February 2026 EOM Report: Inter Market Dynamics
Written by
A Sign Of Time
Head of Education & Toodegrees Analyst
Section 1
Monthly Recap: HTF Power Of Three Dashboard (NQ)
HTF Power Of Three Dashboard
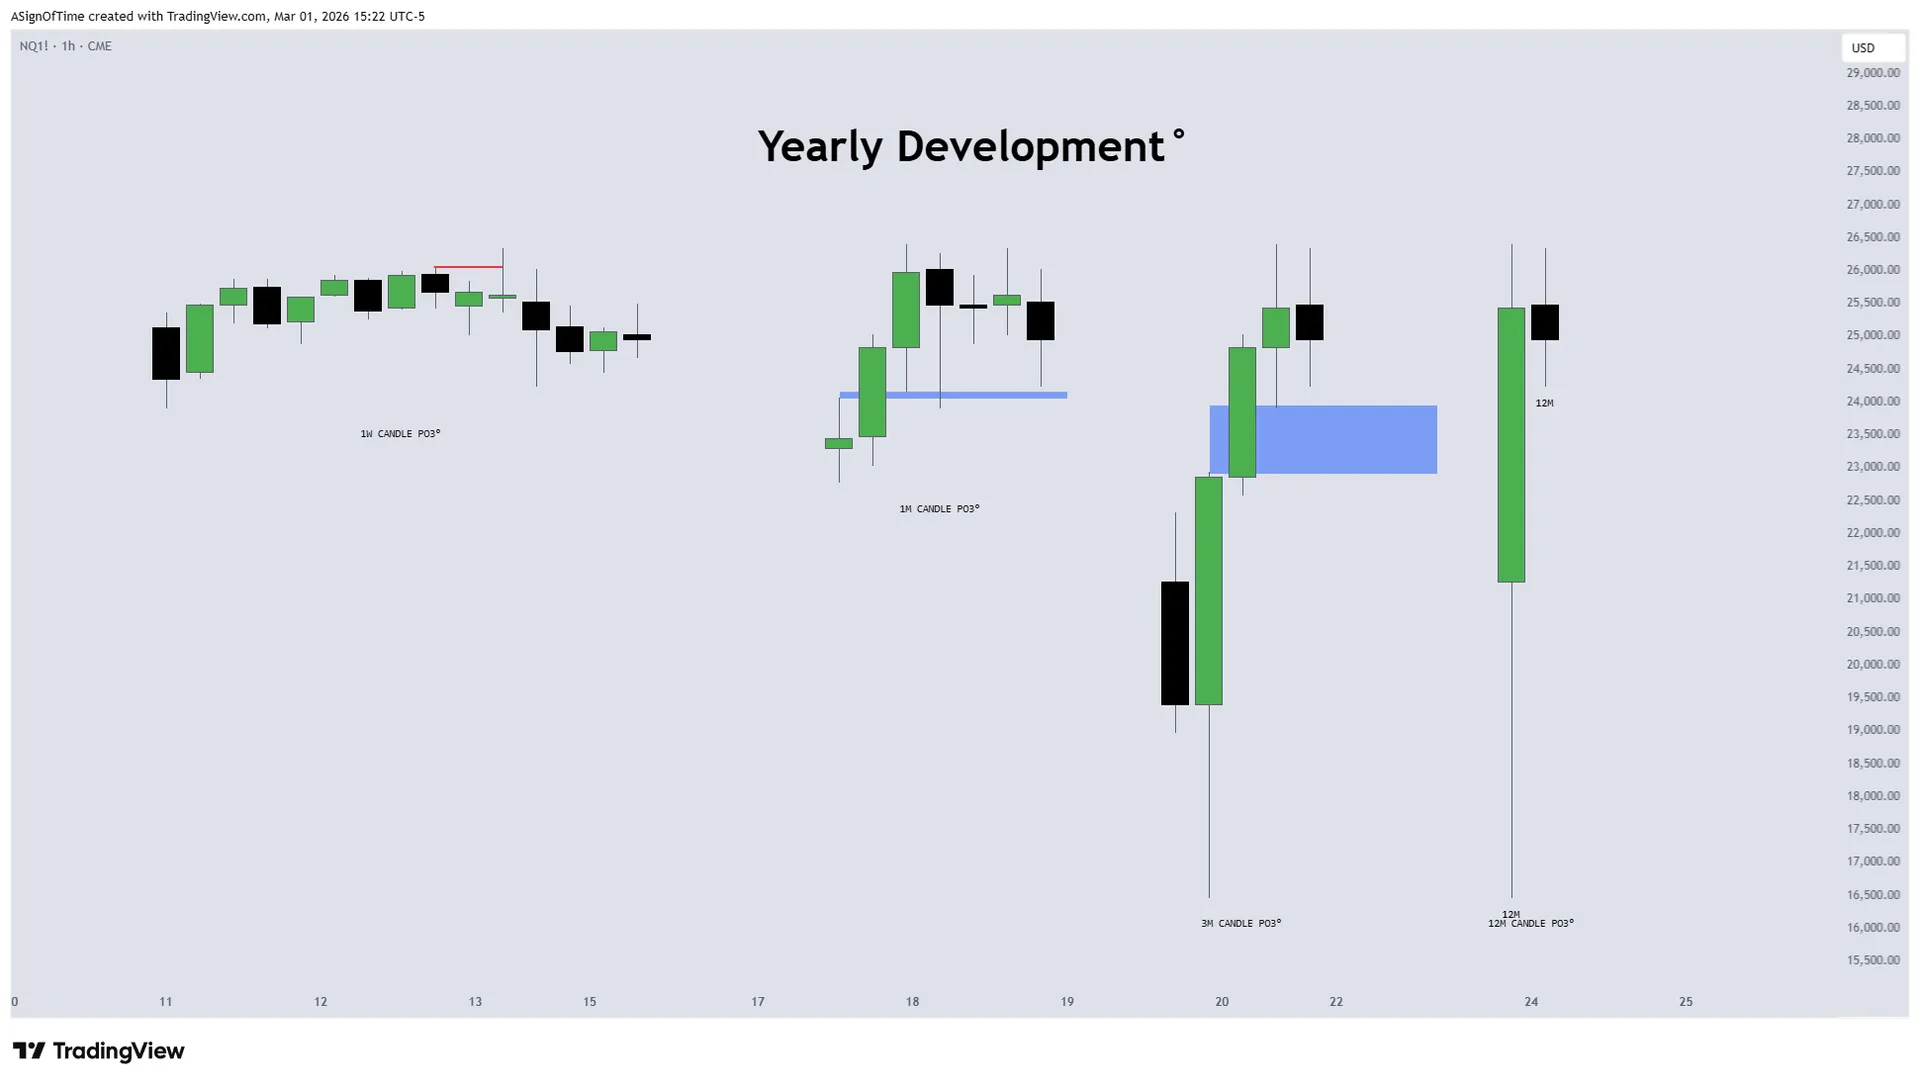
The higher-timeframe structure on $NQ continues to reflect an orderly yearly development. Across the 1W, 1M, 3M, and 12M candles, price remains aligned with the broader Power of Three framework, with key points of interest continuing to guide market behavior. February price action respected higher-timeframe structure, with pullbacks remaining contained.
Price traded into discount relative to recent ranges without violating key structural lows, and no higher-timeframe candle body closures occurred below major reference levels.
Despite short-term volatility, the broader structure remains constructive. Price continues to operate within the parameters of a controlled yearly expansion, with higher-timeframe behavior suggesting consolidation rather than distribution at this stage.
Nasdaq 100 Futures ($NQ)
Analyst Insight
February's containment within the broader yearly range confirms that the Power of Three framework is still governing price delivery. No structural violations occurred: pullbacks were absorbed, and the yearly expansion thesis remains intact heading into March.
Section 2
Technical Analysis: Nasdaq 100 E-Mini Futures
NQ Futures
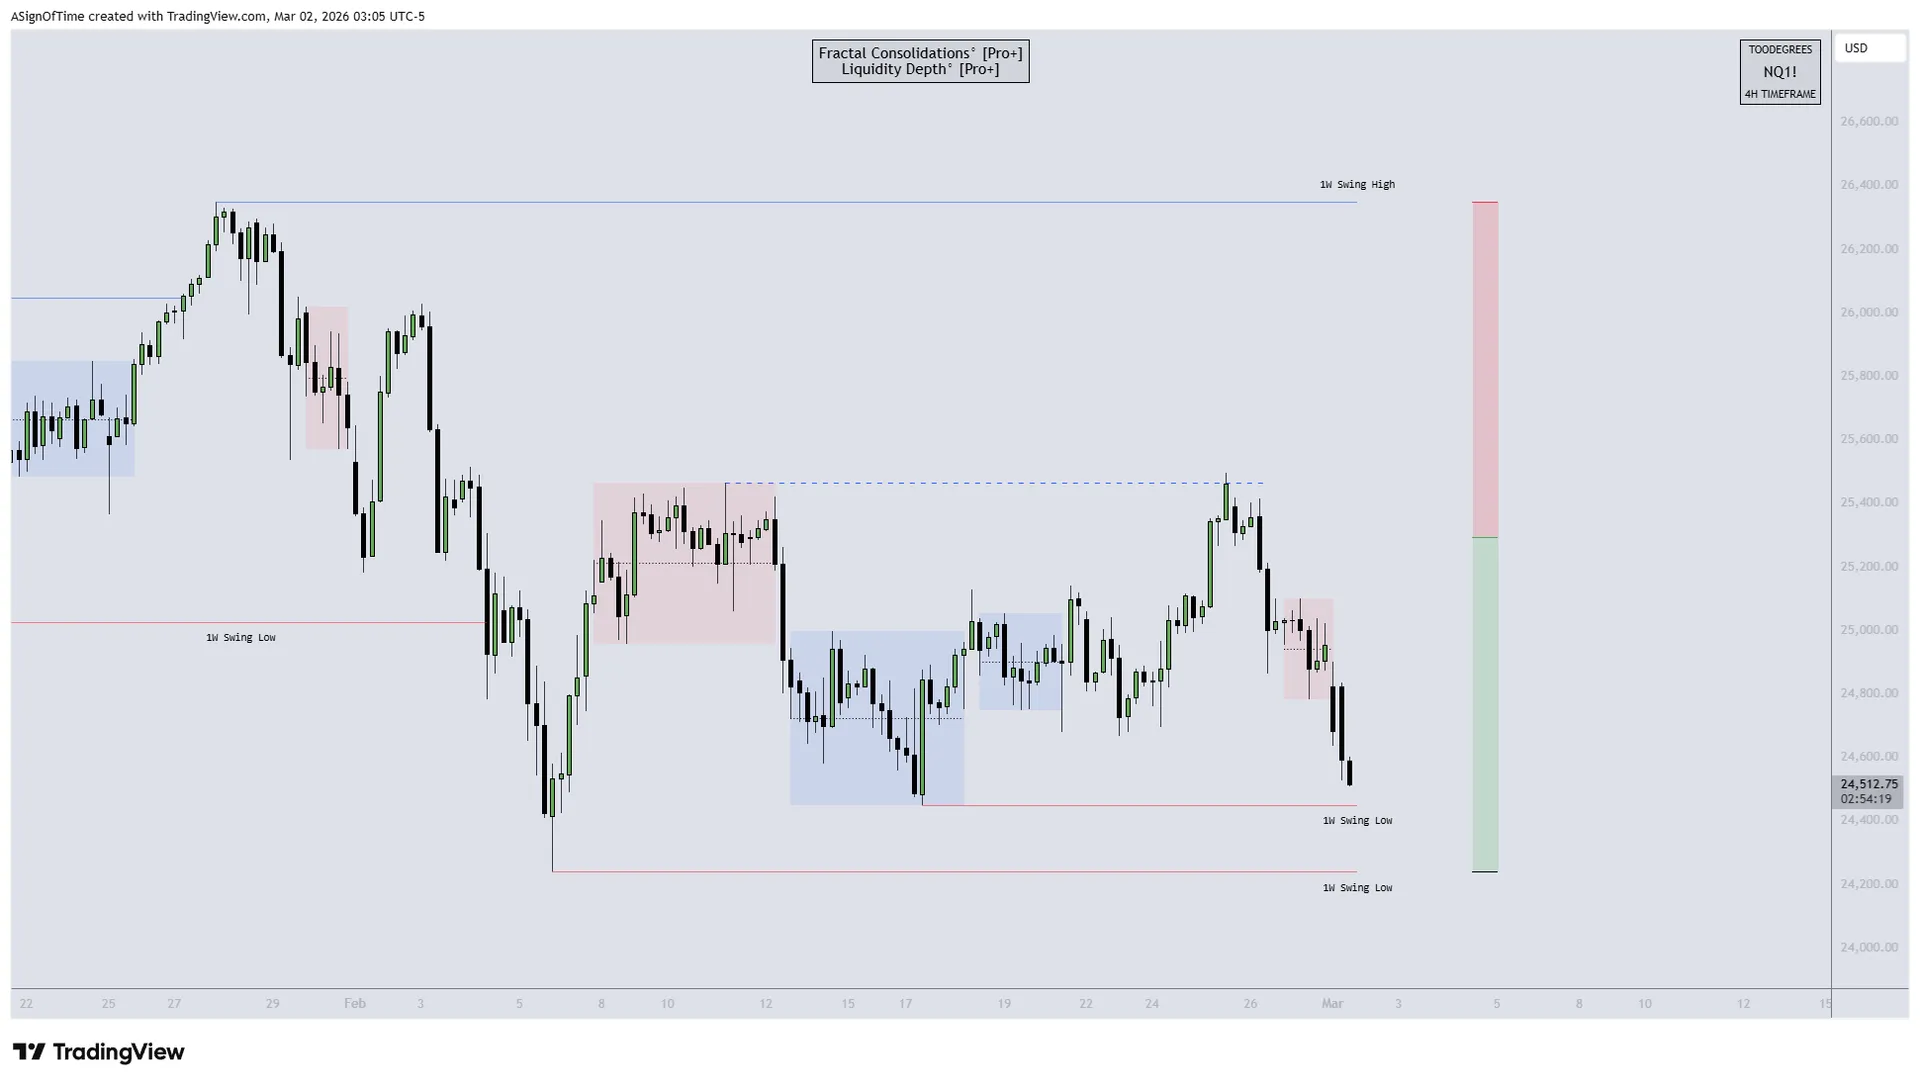
During February, $NQ formed a large trading range between January 27th and February 5th. This range created clear areas of resistance (range highs) and support (range lows), with price moving back and forth inside it rather than trending strongly.
Price moved into the upper half of the range twice but failed to break and hold above it. Each attempt higher was rejected, showing that buyers lacked strength to continue the move. This signaled weakness compared to $YM, which showed stronger relative performance.
Towards the end of the month, price rotated back down toward the lower boundary of the range. The current structure suggests that sellside liquidity below the range lows is now the primary draw.
Section 3
Technical Analysis: Stat Map (NQ)
NQ Futures
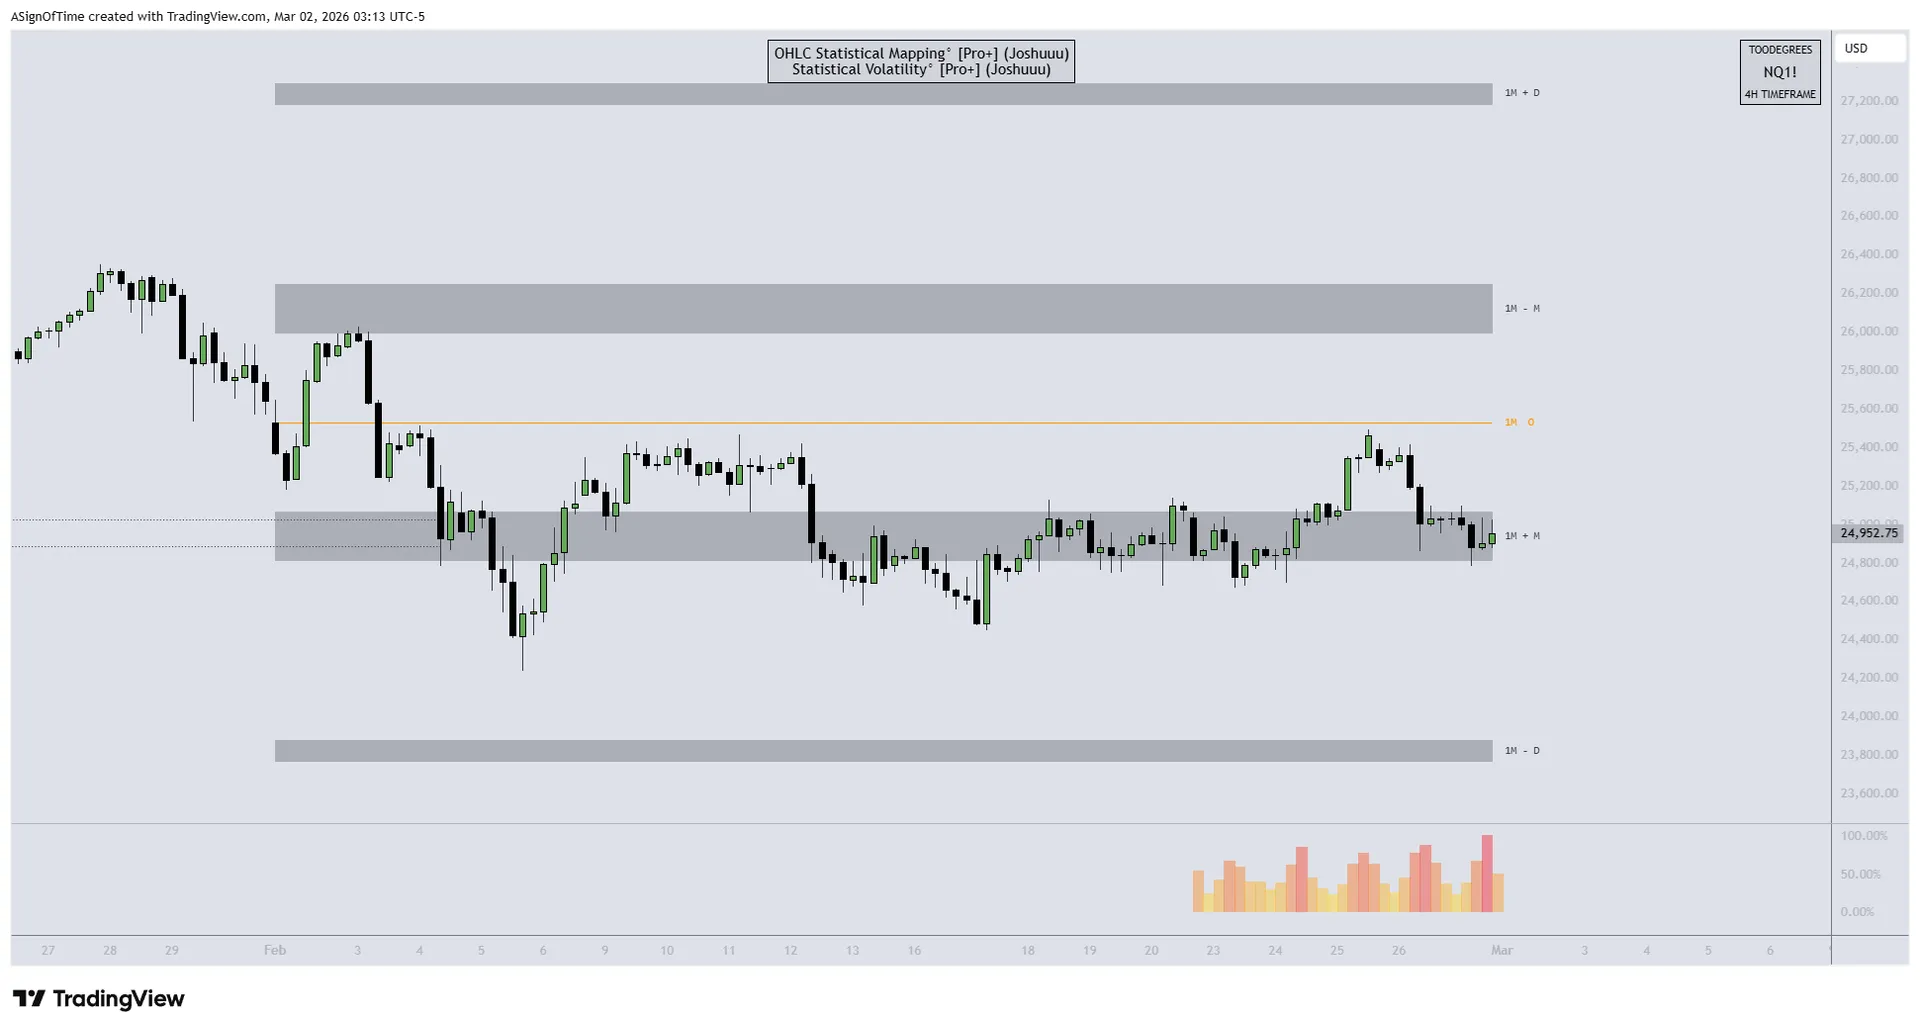
On this NQ chart, the StatMap is plotted using the 1-Month Timeframe with a combined calculation method (Both Median and Mean).
During February, price traded between the bullish and bearish manipulation levels without achieving sustained acceptance beyond either boundary. Upside attempts stalled below the upper manipulation range, while downside probes held above the lower statistical boundary.
Price spent the majority of the month rotating around the monthly open and mean level, reinforcing equilibrium rather than directional expansion. This behavior reflects a consolidating market state.
With both manipulation levels respected and no sustained displacement outside the statistical range, February can be characterized as a contained, rotational month within the broader higher-timeframe structure.
Section 4
Monthly Recap: HTF Power Of Three Dashboard (DXY)
HTF Power Of Three Dashboard
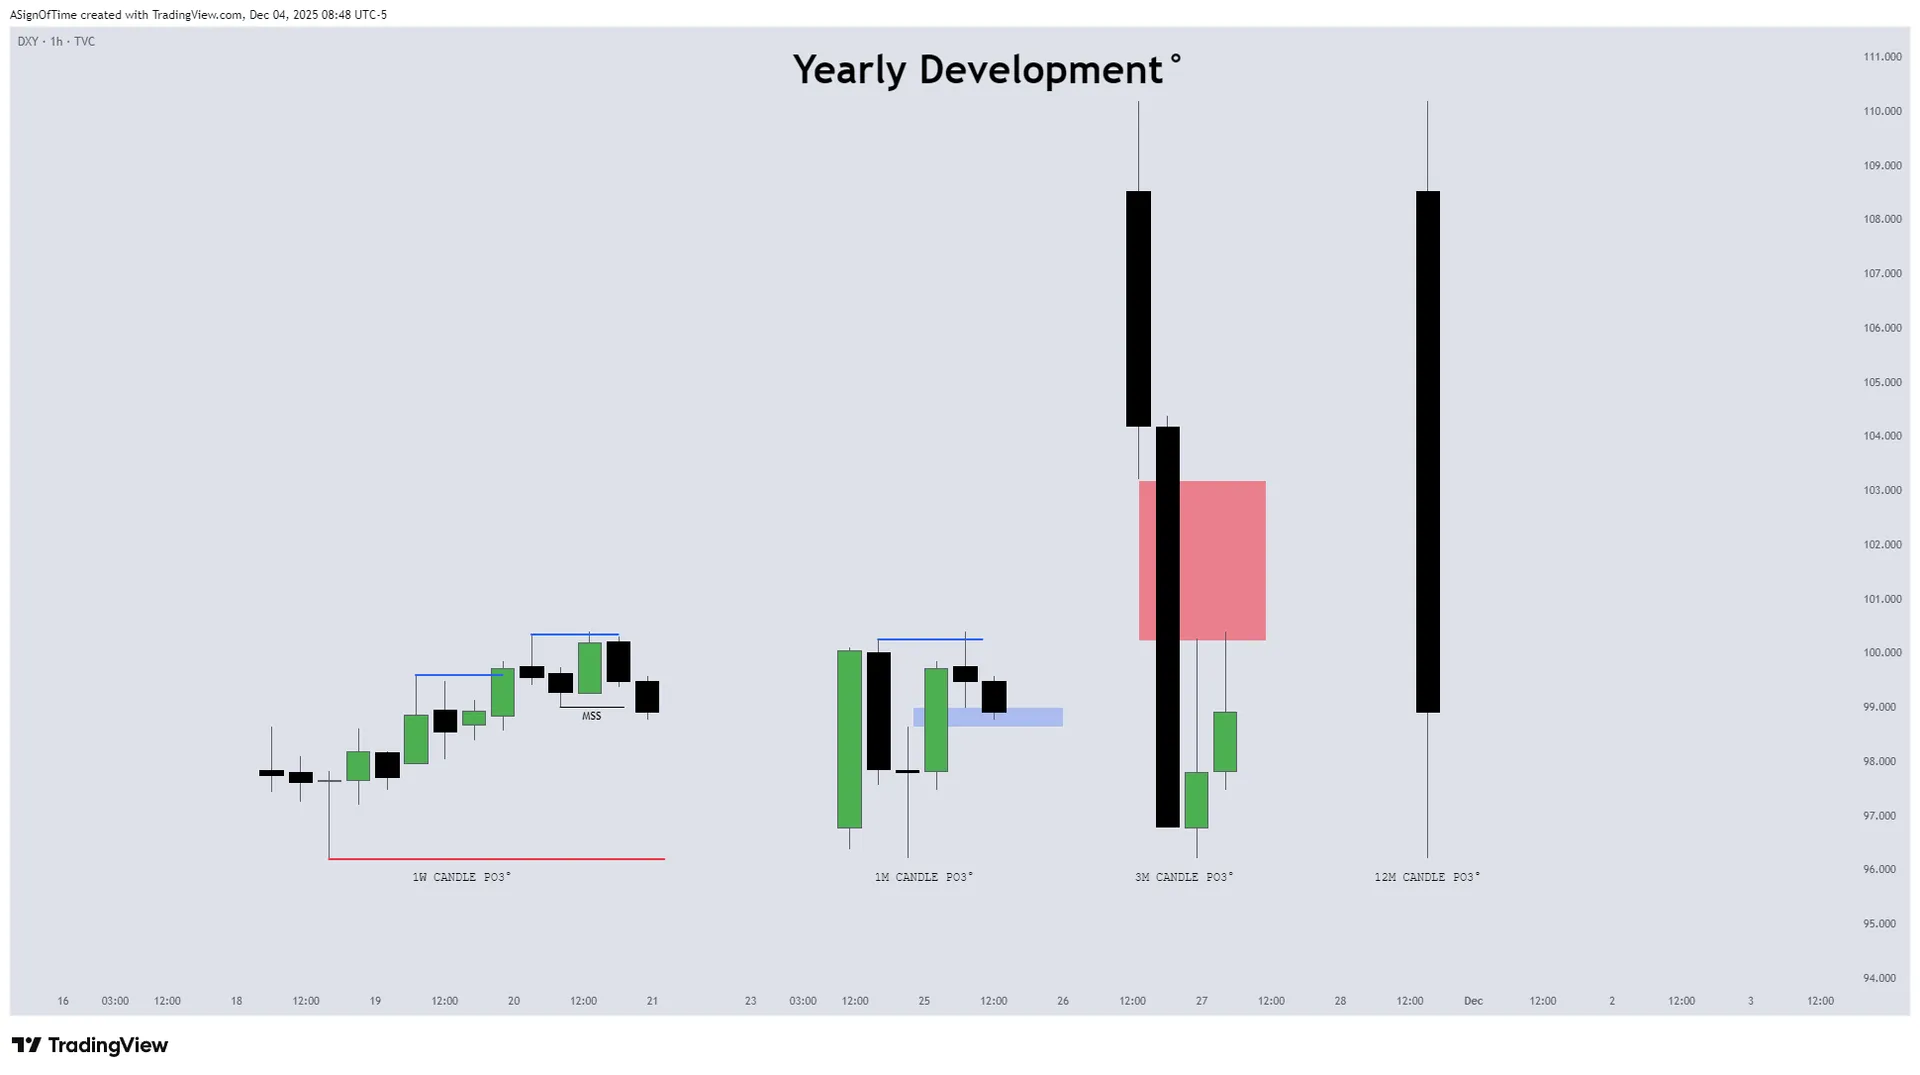
Following the new low established at the end of January, DXY spent February retracing higher within its broader yearly range. The move was corrective in nature, but structurally constructive.
Across the 1W and 1M candles, price rebounded from discount territory and rotated back toward equilibrium. February did not produce impulsive expansion into new yearly highs, but it did confirm responsive demand below recent quarterly lows.
The 3M and 12M structures remain range-bound, with price currently positioned in the mid-portion of the yearly distribution. This suggests recovery rather than trend acceleration.
As long as DXY holds above the late-January low, the February rebound keeps the broader structure intact. A sustained push into quarterly premium would signal continuation, while failure back below January's low would invalidate the recovery narrative.
US Dollar Index (DXY)
Section 5
Technical Analysis: US Dollar Index Daily Chart
US Dollar Index
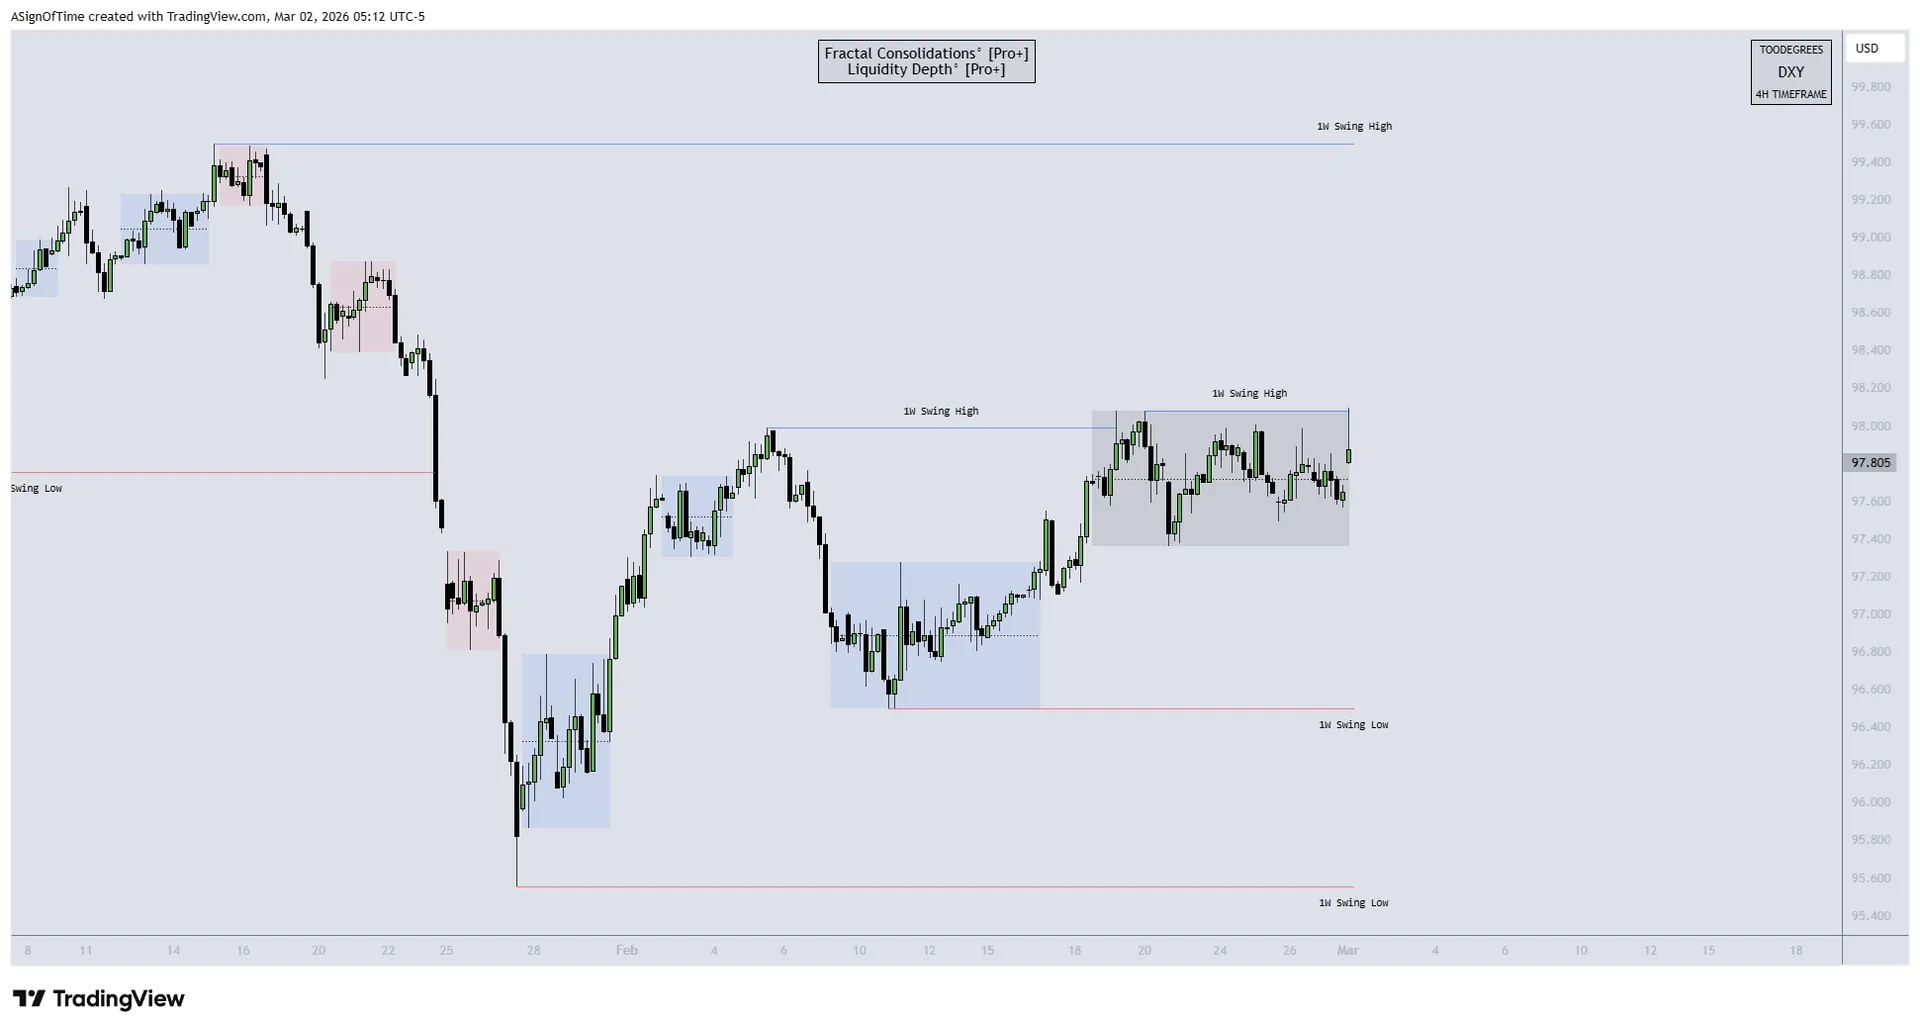
After setting a new swing low at the end of January, DXY spent February retracing higher within the dealing range.
Price advanced from discount, forming short-term higher lows and drawing toward opposing liquidity. The month culminated in a sweep of prior 1W buyside liquidity, as price traded above the previous weekly swing high.
As long as price holds above the February higher lows, the recovery structure remains intact. Failure would expose internal range liquidity and potentially the January swing low.
Section 6
Technical Analysis: Stat Map (DXY)
US Dollar Index: Statistical Mapping
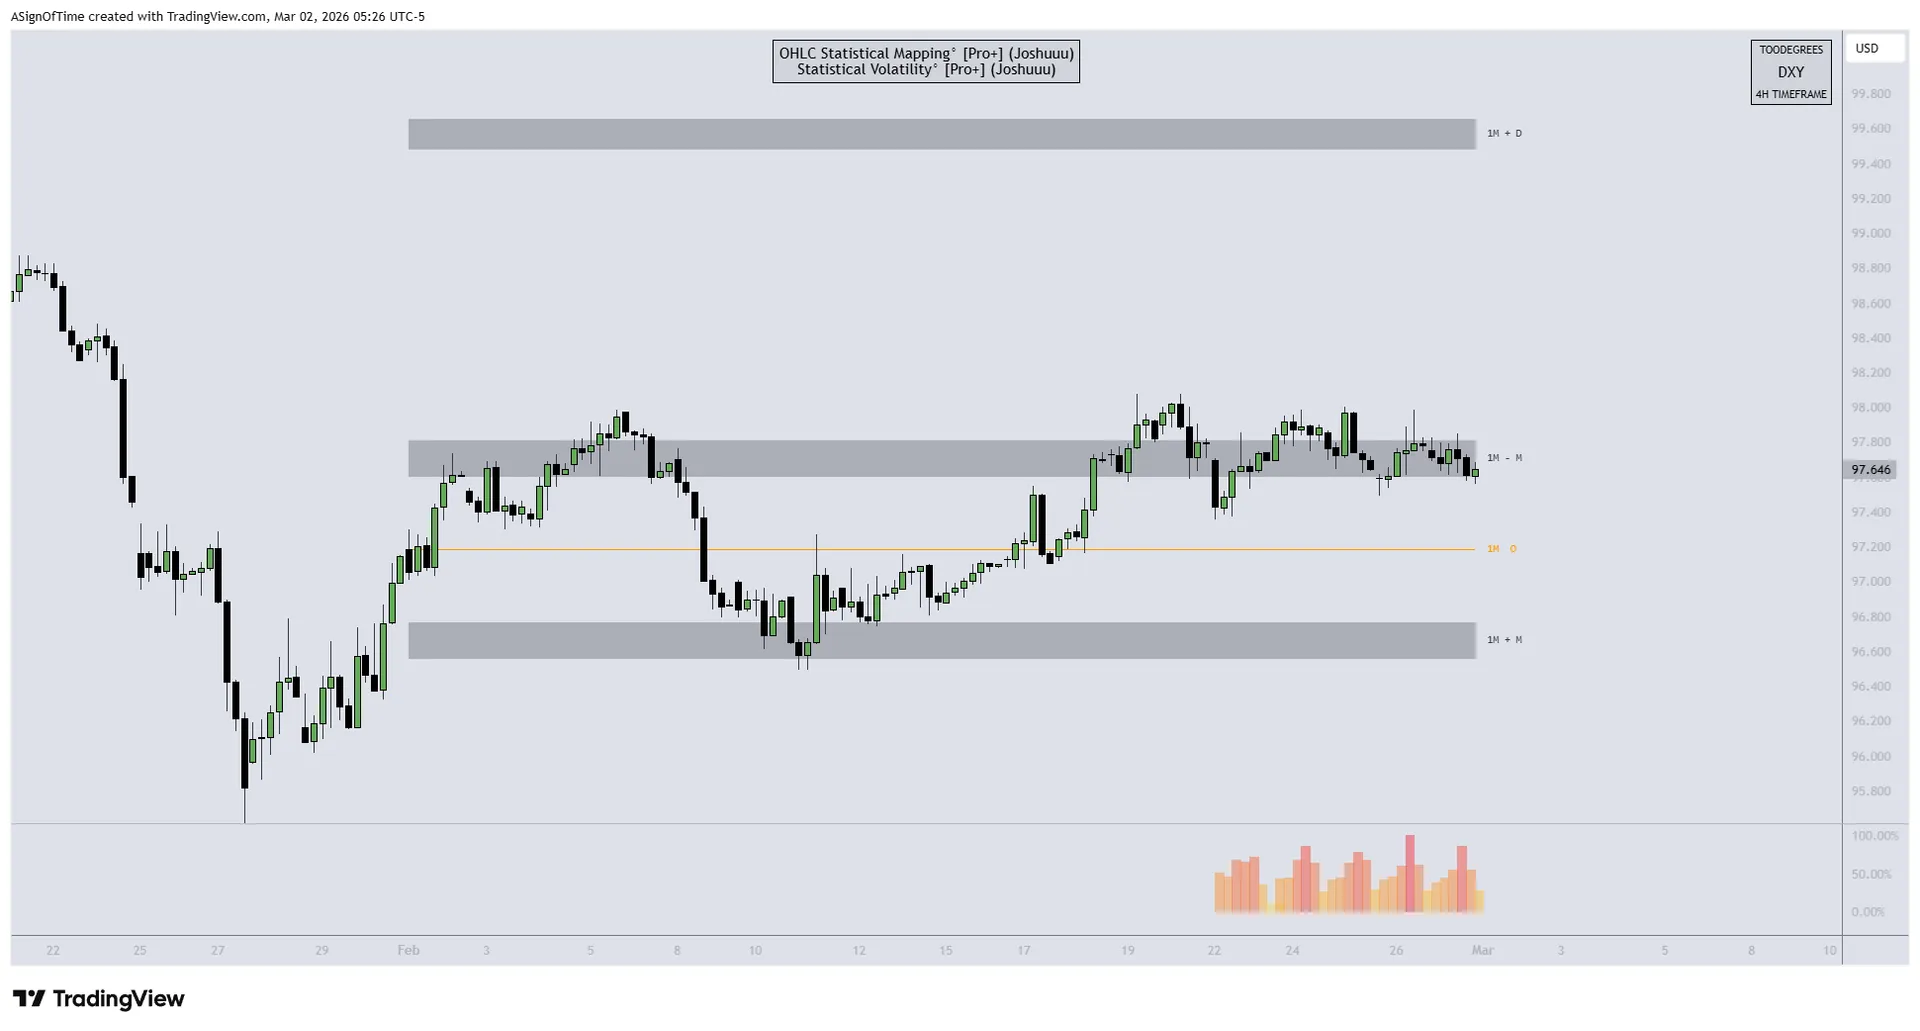
On the 1-Month Stat Map (Median + Mean), DXY remained contained between the bullish and bearish manipulation zones throughout February.
After setting the late-January low near the lower manipulation boundary, price expanded upward but failed to reach the upper statistical extreme. Instead, it rotated back toward the monthly mean and spent the remainder of the month consolidating.
This behavior characterizes February as a balanced, corrective month not directional expansion. DXY remained inside its statistical range, confirming consolidation rather than trend continuation.
A sustained move beyond either manipulation boundary would be required to signal a shift from range conditions to expansion.
Section 7
Inter-Market Dynamics
A quick overview of all three asset classes, NQ, DXY, and T-Bonds, tracking orderflow, seasonality, open interest, market condition, COT positioning, and interest rate context as of February 2026.
| Metric | NQ | DXY | T-Bonds |
|---|---|---|---|
| Orderflow | Bearish → Bullish | Neutral → Bearish | Bearish → Bullish |
| Seasonality | Bullish → Sideways | Bullish → Bearish | Bullish → Sideways |
| Open Interest | Rising | Declining | Declining |
| Market Condition | Consolidating | Consolidating | Expanding |
| COT Report | Net Short | Net Short | Net Long |
| Interest Rate | — | — | 3.75% to 4.00% |
Analyst Insight
February's inter-market picture tells a consistent story of rotation rather than trend. NQ orderflow shifted bearish-to-bullish yet market conditions remain consolidating, accumulation in progress, not expansion. DXY's declining OI despite a corrective bounce confirms short covering rather than fresh longs. T-Bond expansion with net long COT continues to bid for safety. March catalysts will be key to resolving these cross-asset tensions.
Section 8
Conclusion: Analysis Recap
February reflected a market environment defined by corrective pressure and selective repricing rather than broad expansion. Across asset classes, movements were driven by rotation and recalibration rather than synchronized trend continuation.
U.S. equities largely declined during the month, with prior momentum fading and price compressing back into higher-timeframe ranges. The pullback appeared rotational rather than disorderly, as volatility remained contained and structural support levels held. Seasonal tendencies provided context, though geopolitical tensions continue to add macro sensitivity.
In FX, the U.S. Dollar retraced higher after setting a late-January low, trading back into prior weekly liquidity pools. However, declining Open Interest suggests the advance was driven more by short covering than aggressive new positioning, while EUR and GBP reflected relative weakness within corrective structures.
Rates markets saw coordinated repricing across the Treasury curve, led by intermediate maturities. The yield curve continues its gradual normalization, with the front end anchored and the long end elevated due to persistent term premium and fiscal uncertainty.
Overall, February reinforces the view of markets operating within a broader transition phase. As March unfolds, attention shifts toward liquidity dynamics and macro catalysts that may determine whether corrective moves evolve into sustained directional expansion.
Featured Indicator