Indicator Insight: Automatic OTE

Written by
KM
Creative Director & Experience Lead
Key Summary
- Automatic OTE° [Pro+] anchors a Fibonacci retracement to a timeframe you select, then plots the High, Low, Equilibrium and Optimal Trade Entry of that range for you.
- OTE is coded as the .62 retracement of the previously selected candle, the level ICT teaches as the point where price enters an optimal trade entry area.
- Live OHLC Mode builds the range from the developing candle instead of waiting for the close, and still keeps history accurate once that candle completes.
- Zone Highlights shade the space between any two levels, and the FVG overlay splits gaps into premium or discount against EQ at 50%.
The same retracement, anchored the same way every session
Most traders learn Fibonacci early and then apply it inconsistently. The swing you anchor to at 7am is not the swing you would have picked at lunch, so the premium and discount read shifts with your mood rather than with the market.
Automatic OTE° [Pro+] takes the choice out of it. You set the timeframe to anchor from, and the tool pulls the high and low of that range automatically. Monthly, Weekly, Daily, 4H, 1H and 15m cover most desks, and custom TradingView times handle 90 minute candle ranges and other bespoke intervals. Select the 1 Day chart and it anchors from the previous day's high and low.
Built in collaboration with FX4LIVING (@FX4_Living), with default levels taken from the models he actually trades. Your framework. Our automation.
OTE is the .62, and the range around it is the context
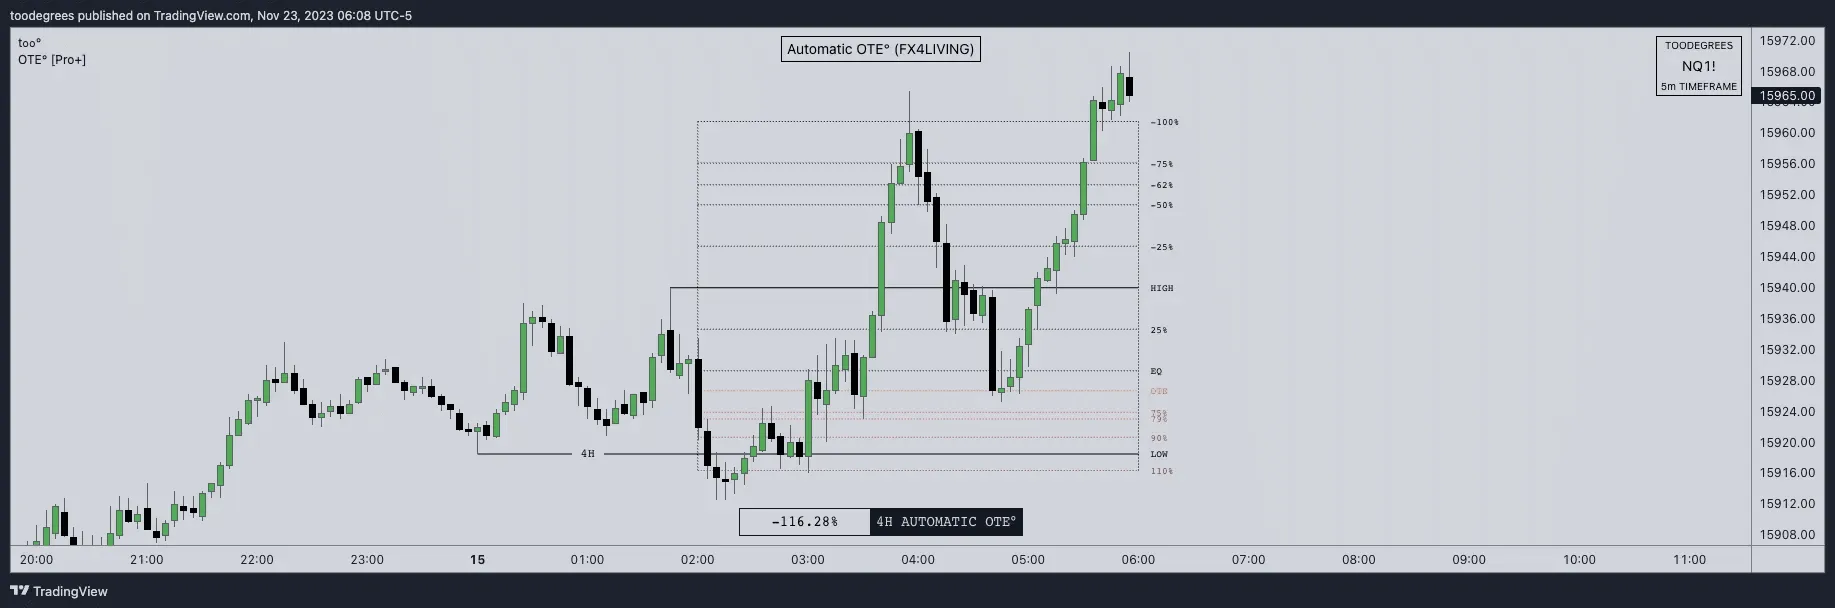
The key levels are grouped deliberately: High, Low, Equilibrium and the Optimal Trade Entry. OTE is coded as a .62 retracement of the previously selected candle, which is the level ICT points to as the entry area once price has retraced into it.
That framing is what makes the rest usable. Above EQ is premium, below EQ is discount, and the OTE marks deep premium or deep discount relative to the timeframe you anchored to. Longs belong in discount, shorts belong in premium, and pairing the OTE area with PD arrays and the right killzone is where the read gets sharper.
The OTE Table prints the current price as a percentage of the selected range, where the High and the Low are 0% and 100% interchangeably, and recolours as price approaches the OTE. It keeps working with the Fibonacci levels hidden, and you can place and size it wherever it stays out of the way.
Live OHLC Mode reads the candle before it closes
Waiting for a candle to complete is fine in review and expensive in execution. Live OHLC Mode calculates the OTE from the developing candle, so the range is built as price trades and every toggled level updates on each new tick.
As the candle reaches new highs and lows the range expands and all derived levels recalculate with it. Once the candle completes, the levels are fixed, so the historical read behind you stays accurate while the live one keeps moving.
Time Anchors work alongside it: toggle them and the levels plot from the previous candle close through to the selected timeframe's close, encapsulating the window itself, just as our London Intraday Protraction tool does for London Open.
Zone Highlights turn levels into areas
A line tells you where a level is. A zone tells you where you are. Zone Highlights shade the space between any two levels using a simple format, Level1:Level2:Color, so EQ:High:Red paints the whole premium half of the range.
Separate several with commas, as in 0.62:0.79:Orange, OTE:High:Orange. Level names are case-insensitive, and negative and extended values are supported, so -1.5:-1.25:Green marks an extension target the same way. Fifteen colours are available, and one global Opacity control runs from 0 for solid to 100 for fully transparent.
The point is not decoration. It is being able to glance at a chart mid-session and see premium, discount and the OTE band as areas instead of counting lines.
The FVG overlay reads gaps against EQ
Fair value gaps that form inside each OTE period are detected automatically and plotted inside the active range, then classified premium or discount relative to EQ at 50%. A gap in discount and a gap in premium are not the same trade, and the overlay is what makes that visible without a second indicator.
Detection Timeframe defaults to the chart timeframe and can be set higher. Premium and discount get their own colours, Max FVGs caps how many show per OTE with the oldest dropping off as new ones form, and Extend controls how they behave after detection.
Mitigation Logic decides when a gap is considered used and removed: OFF, Wick or Close. The Detection setting only affects chart-timeframe gaps, since higher-timeframe FVGs are always confirmed. Size Filtering then trims the noise with All, S+M+L, M+L, Large Only or Custom, and a Min Size of 0 shows everything.
What it doesn't do
It is not a signal generator. It does not call direction, it does not fire an entry, and price tagging the .62 is not an instruction. All the tool states is where price is trading inside a range you defined, and what is premium or discount within it.
What changes is the prep. The retracement you used to redraw every session is anchored, consistent across timeframes, and already carrying its zones, its gaps and its percentage readout before the session starts. You still read the context and make the call. Tools, not signals.
Key Questions
It is an ICT concept that uses Fibonacci retracements to judge whether price is in premium or discount. When price retraces 62% of the anchored swing it enters the area considered an optimal trade entry, and Automatic OTE codes that .62 level of the previously selected candle for you.
The one you actually trade from. Monthly, Weekly, Daily, 4H, 1H and 15m are the common choices, and custom TradingView times cover 90 minute ranges and other intervals. Anchoring to 1 Day builds the range from the previous day's high and low. The chart above runs a 4H OTE on a 5m execution chart.
It builds the OTE from the developing candle rather than waiting for the close, so every toggled level updates on each tick as the range expands. Once the candle completes, the levels stop moving and the historical read stays accurate.
What Automatic OTE° [Pro+] Plots
| Feature | What It Shows | Why It Matters |
|---|---|---|
| Timeframe anchor | High and low of the timeframe you select | One consistent range instead of a fresh manual draw |
| Key levels | High, Low, Equilibrium and OTE | Premium and discount read from a fixed reference |
| OTE level | The .62 retracement of the selected candle | The entry area as ICT defines it, plotted automatically |
| Live OHLC Mode | Levels built from the developing candle | Read the range without waiting for the close |
| Time Anchors | Plots from previous close to the selected close | Frames the time window, not just the price range |
| Zone Highlights | Shaded areas between any two levels | Premium, discount and extensions as areas, not lines |
| FVG overlay | Gaps inside the range, split at EQ | Inefficiencies read in premium or discount context |
| OTE Table | Current price as a percentage of the range | Know where price sits with the levels hidden |
Toodegrees builds tools, not signals. Automatic OTE° anchors the range and plots the optimal trade entry, then leaves the read to you.
Come read premium and discount live
We anchor the range and trade the retracements live every session in the free Toodegrees Discord.
Frequently Asked Questions
No. Levels are anchored to the confirmed high and low of the selected timeframe. Live OHLC Mode updates the developing candle in real time by design, and once that candle completes its levels are fixed, so the history behind you does not move.
No. Automatic OTE is a structural reference, not a signal generator. It shows where price is trading inside the range you anchored and what counts as premium or discount within it. Tools, not signals.
Yes. The defaults were created with @FX4_Living and match the levels used in his own models, but you can toggle individual levels off or enter your own values, and set the colour, style and width of each line and key level.
It is designed for futures, forex and bond markets, and reads whatever instrument and timeframe you put it on. Timeframe selection is what makes it work for scalpers, intraday traders, swing traders and position traders from the same tool.
Automatic OTE is built with FX4LIVING, so like every collaborator tool it comes with the Elite Collection or as a standalone indicator, not with the Premium Suite, which is the in-house bundle. It is invite-only on TradingView and added to your account once you're in.
Continue Reading
Ready to Automate Your Analysis?
Join 30,000+ traders using Toodegrees indicators to save time and find higher-probability setups.