Indicator Insight: Forever Model

Written by
KM
Creative Director & Experience Lead
Key Summary
- Forever Model° [Pro+] ($niper) only plots a model when price tags internal range liquidity, SMT divergence forms against a correlated market, and a lower timeframe CISD confirms, in that order.
- The CISD candle becomes the order block. Projections and external range liquidity give the rotation its reference points.
- Cycle Mode drops the fair value gap requirement and reads 90 minute and 6 hour cycle raids instead, with live SMT and AMD boxes classified by quarterly theory.
- It is non-repainting and it does not call direction. Bias, entry zone, invalidation, history and session filters decide what reaches your chart.
Three reads that rarely line up on one chart
You mark the fair value gap on the higher timeframe. You flip to the correlated index to see whether it took the same low. Then you drop down a few timeframes and wait for a candle to close back through its open.
Each read needs its own chart, and none of them means much alone. A gap without divergence is just a gap. Divergence without a delivery shift is a warning with nothing to act on.
Forever Model° [Pro+] ($niper) runs that sequence for you. It is a framework for internal to external liquidity rotations, and it draws a model only when all three conditions have happened in order. Built in collaboration with $niper. Your framework. Our automation.
Tag, divergence, delivery shift, in that order
Each condition gates the next one. First, price has to interact with internal range liquidity, usually a fair value gap on the higher timeframe. If price never trades into a gap, the model does not evaluate SMT or CISD at all.
Second, SMT divergence. One correlated asset makes a lower low while the other holds a higher low, or one makes a higher high while the other prints a lower high. The manual treats that crack in correlation as a dislocation in price delivery.
Third, a change in state of delivery on the lower timeframe. A candle sweeps a short-term high or low, then closes beyond its own open. That candle is plotted as the order block, and the model is complete.
Timeframe alignment decides which chart does which job. The higher timeframe supplies the gap and the SMT, and the lower timeframe frames the delivery shift. The automatic pairings follow ICT's timeframe alignment from Price Action Model 6 and 7, and a Custom setting lets you choose your own.
Picking what to diverge against
SMT is only as useful as the pair behind it. Auto SMT selects a correlated market for your chart, so NQ1! pairs with ES1! by default. If you think a single stock leads the index, you can enter NVDA against NQ1! instead.
Inverse SMT flips the comparison for negatively correlated pairs, with gold against the dollar as the manual's example. An additional SMT pair lets the model validate divergence across two correlations at once, so a EURUSD chart can track DXY, and an index chart can compare NQ, ES and YM together.
SMT lines connect the divergent points on both assets, so you can see exactly where the correlation cracked. The same read works as relative strength. If NQ1! makes a lower low while ES1! holds a higher low, NQ1! is the weaker of the two.
From the order block out to external range
Liquidity sweep markers show the short-term high or low that was taken before the CISD. Order matters here too. The sweep has to happen before the candle closes beyond its open, or the order block does not count.
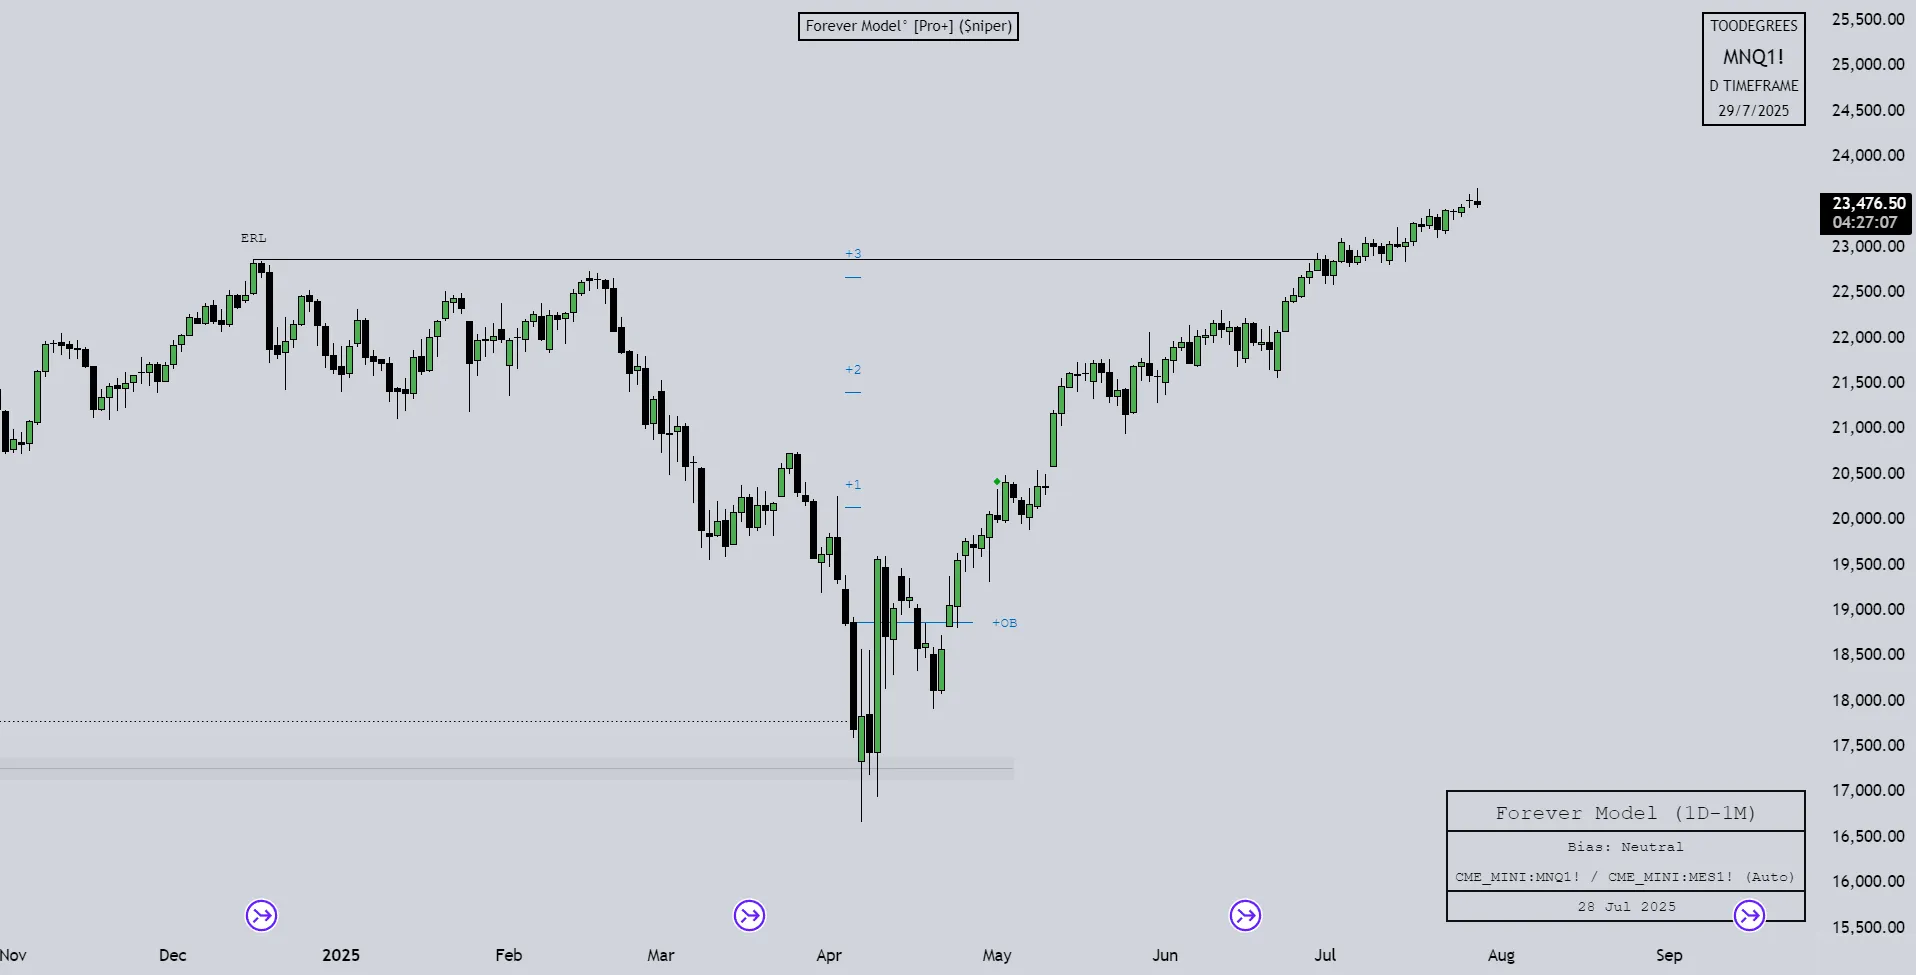
From the order block, projections extend at distances you set, and you can define several at once. The chart above shows three of them stepping up from a daily order block. The manual describes them as optional reference points that follow the model's geometry, and says outright that they are not fixed targets.
External range liquidity completes the rotation. ICT describes price trading from external range to internal range and back out again, and ERL marks the highs and lows beyond the internal structure that often become the objective after a rotation. On the chart above, it is the prior high labelled ERL on the left.
Cycle Mode, for sessions without a clean gap
Price does not always leave a qualifying fair value gap. Cycle Mode removes that requirement and frames the setup from time. A valid setup forms when one correlated asset raids the previous 90 minute or 6 hour cycle extreme, the comparison asset fails to make the same move, and a CISD confirms it.
SMT runs live in this version. Earlier releases needed confirmed swing points before divergence could register. The current model evaluates divergence as price develops, so a forming SMT appears before the swing is confirmed. Order block qualification is also stricter in Cycle Mode.
AMD cycle boxes profile each completed cycle as Accumulation, Manipulation, Distribution, or X for expansion, reversal or retracement, based on where the cycle sits in the quarterly sequence. By default a 5 minute chart shows 90 minute cycles and a 15 minute chart shows 6 hour cycles. One toggle displays both tiers at once.
Filters that decide what reaches your chart
Bias restricts formations to bullish, bearish or neutral, which helps once the higher timeframe has made its call. Entry Zone Threshold sets how deep an order block has to sit. Deep Retracement keeps setups near the dealing range low in bullish conditions and near the high in bearish ones. Continuation lets them form anywhere inside the range.
Invalidation can follow SMT failure instead of order block failure. The model also adjusts by timeframe: SMT logic takes priority on lower timeframes, and traditional order block invalidation applies from 1H and above.
History shows up to 40 past models. At 0 you see only the latest active bullish and bearish model, or just the fair value gaps if nothing is live. Invalidated rotations shrink to small markers so the chart stays readable, and session filters with a custom timezone, New York by default, limit formations to the hours you trade.
What it doesn't do
It does not forecast direction, and a completed model is not an entry. The manual describes it as a visual framework for understanding market delivery, and rules out forecasting and trade execution by name.
What it takes off your plate is the checklist you were running by hand across several charts. The gap, the divergence and the delivery shift are tracked in one place and filtered by your bias and sessions before you decide anything. You still read the context and make the call. Tools, not signals.
Key Questions
A crack in correlation between two related assets at the same time. One makes a lower low while the other holds a higher low, or one makes a higher high while the other makes a lower high. Forever Model compares your chart against the SMT pair you enter, or the one Auto SMT selects.
A lower timeframe candle that sweeps a short-term high or low and then closes beyond its own open. The sweep has to come first. When both happen after SMT has formed, that candle is plotted as the order block.
FVG Mode is the original model and needs a higher timeframe fair value gap, SMT and a CISD. Cycle Mode needs no gap: it looks for one asset raiding the prior 90 minute or 6 hour cycle extreme while its pair fails to, then a CISD. The manual points to Cycle Mode for sessions where price delivers cleanly without leaving a qualifying gap.
What Forever Model° [Pro+] ($niper) Plots
| Element | What It Shows | Why It Matters |
|---|---|---|
| Internal Range Liquidity | Higher timeframe fair value gaps, with optional CE | No tag, no model. The gap gates every condition after it |
| SMT divergence | A crack in correlation against one or two SMT pairs | Marks a possible dislocation in delivery |
| Liquidity sweep | The short-term high or low taken before the CISD | The sweep has to come first for the order block to count |
| CISD order block | The candle that swept and closed beyond its open | Your reference structure once the model completes |
| OB projections | Levels at distances you set from the order block | Reference points from the model's geometry, not fixed targets |
| External Range Liquidity | Highs and lows beyond the internal range | The objective after an internal to external rotation |
| Cycle Mode | 90 minute and 6 hour cycle raids with live SMT | Setups when price leaves no qualifying gap |
| AMD cycle boxes | Completed cycles classified A, M, D or X | Where the session sits in the quarterly sequence |
| Info table | SMT pair, bias, session and alignment status | The model's operating conditions at a glance |
Toodegrees builds tools, not signals. Forever Model° tracks the tag, the divergence and the delivery shift, then leaves the read to you.
Watch the model form in real time
We track SMT and delivery shifts every session in the free Toodegrees Discord.
Frequently Asked Questions
No. The model is documented as stable and non-repainting, and it draws setups once they have formed. Historical models that were later invalidated collapse to small markers to keep the chart clean, and Replay Mode shows their full components if you want to review one.
No. Forever Model is a structural framework. It shows where an internal range tag, SMT and a CISD have lined up, and the decision stays with you.
Start with Auto SMT, which picks the correlated market for your chart, such as ES1! for NQ1!. Switch to a custom pair when you track a specific leader, turn on Inverse SMT for negatively correlated pairs, and add a second pair to validate across two correlations. Auto SMT does not support CFDs, and if Auto SMT and Inverse SMT are both on, Inverse SMT is ignored.
Yes. Turn on the Alerts? toggle in the settings, then open the menu next to the indicator's name on your chart and add an alert on Forever Model.
Forever Model is built with $niper, so like every collaborator tool it comes with the Elite Collection or as a standalone indicator, not with the Premium Suite, which is the in-house bundle. It is invite-only on TradingView and added to your account once you're in.
Continue Reading
Ready to Automate Your Analysis?
Join 30,000+ traders using Toodegrees indicators to save time and find higher-probability setups.