Indicator Insight: HTF PO3

Written by
KM
Creative Director & Experience Lead
Key Summary
- Power of Three describes three phases inside the formation of a single candle: accumulation, manipulation, and distribution.
- You can't see those phases from your execution chart, because context lives on the higher timeframe and entries happen lower.
- Manipulation is where traders get taken. The HTF candle runs one way to take liquidity before it expands the other.
- HTF Power Of Three° [Pro+] plots the developing HTF candle on your execution chart, with Intra-Bars and volume aggregated per PO3 candle.
You were right, and you still got stopped out
You shorted NQ into the New York open, right at the level you had marked the night before. Price pushed up through it, took your stop, then rolled over and dropped exactly where you said it would.
That is not variance. You sold into the leg that was built to take your stop, and from a 5-minute chart there was no way to see it coming.
The higher timeframe candle that set your bias, the 4H or the daily, only becomes readable once it closes. While it is forming you get a stream of small candles that never tell you which part of the move you are in. By the time the candle prints and the shape is obvious, the trade you wanted has already left.
Every candle delivers in three phases
Power of Three is an ICT idea: a single candle forms in three acts, and once you have seen it you cannot unsee it.
Say it is a bullish daily. First it accumulates, engineering liquidity at or below the open while positions are built quietly. Then it manipulates, dipping under the open to run stops and pull in sellers. Then it distributes, driving up to close well above the open and paying out everything that was set up in the first two acts. A bearish candle does the same thing upside down.
That sequence is fractal, so it shows up on the 4H, the daily and the weekly alike. The catch is that the finished candle only shows you the outcome. The order the phases arrived in, which was the part worth trading, is already gone by then.
The acts are invisible from where you sit
Your bias comes from a high timeframe. Your entries happen on a low one. Those are two different charts, and you can only really watch one at a time.
So while that daily candle grinds through its manipulation leg, your 15-minute chart just shows a clean push in the wrong direction. It has momentum. It breaks a level. Everything you use to make a decision says go, and none of it can tell you the higher timeframe is still setting its trap.
The usual workaround is to flip between layouts, mark the HTF open by hand, and guess whether the current move is the fake or the real one. You find out when the candle closes, right when knowing it stops helping you.
Manipulation is where the money goes
Almost every bad entry in this pattern happens in the same spot, the manipulation leg.
The higher timeframe runs one direction to collect liquidity before it expands the other. A trader watching only the low timeframe reads that run as a breakout and gets in, right as the real move loads up against them. The direction read is usually fine. What is missing is the sequence, and a closed candle hands you that too late to use.
What HTF Power of Three draws
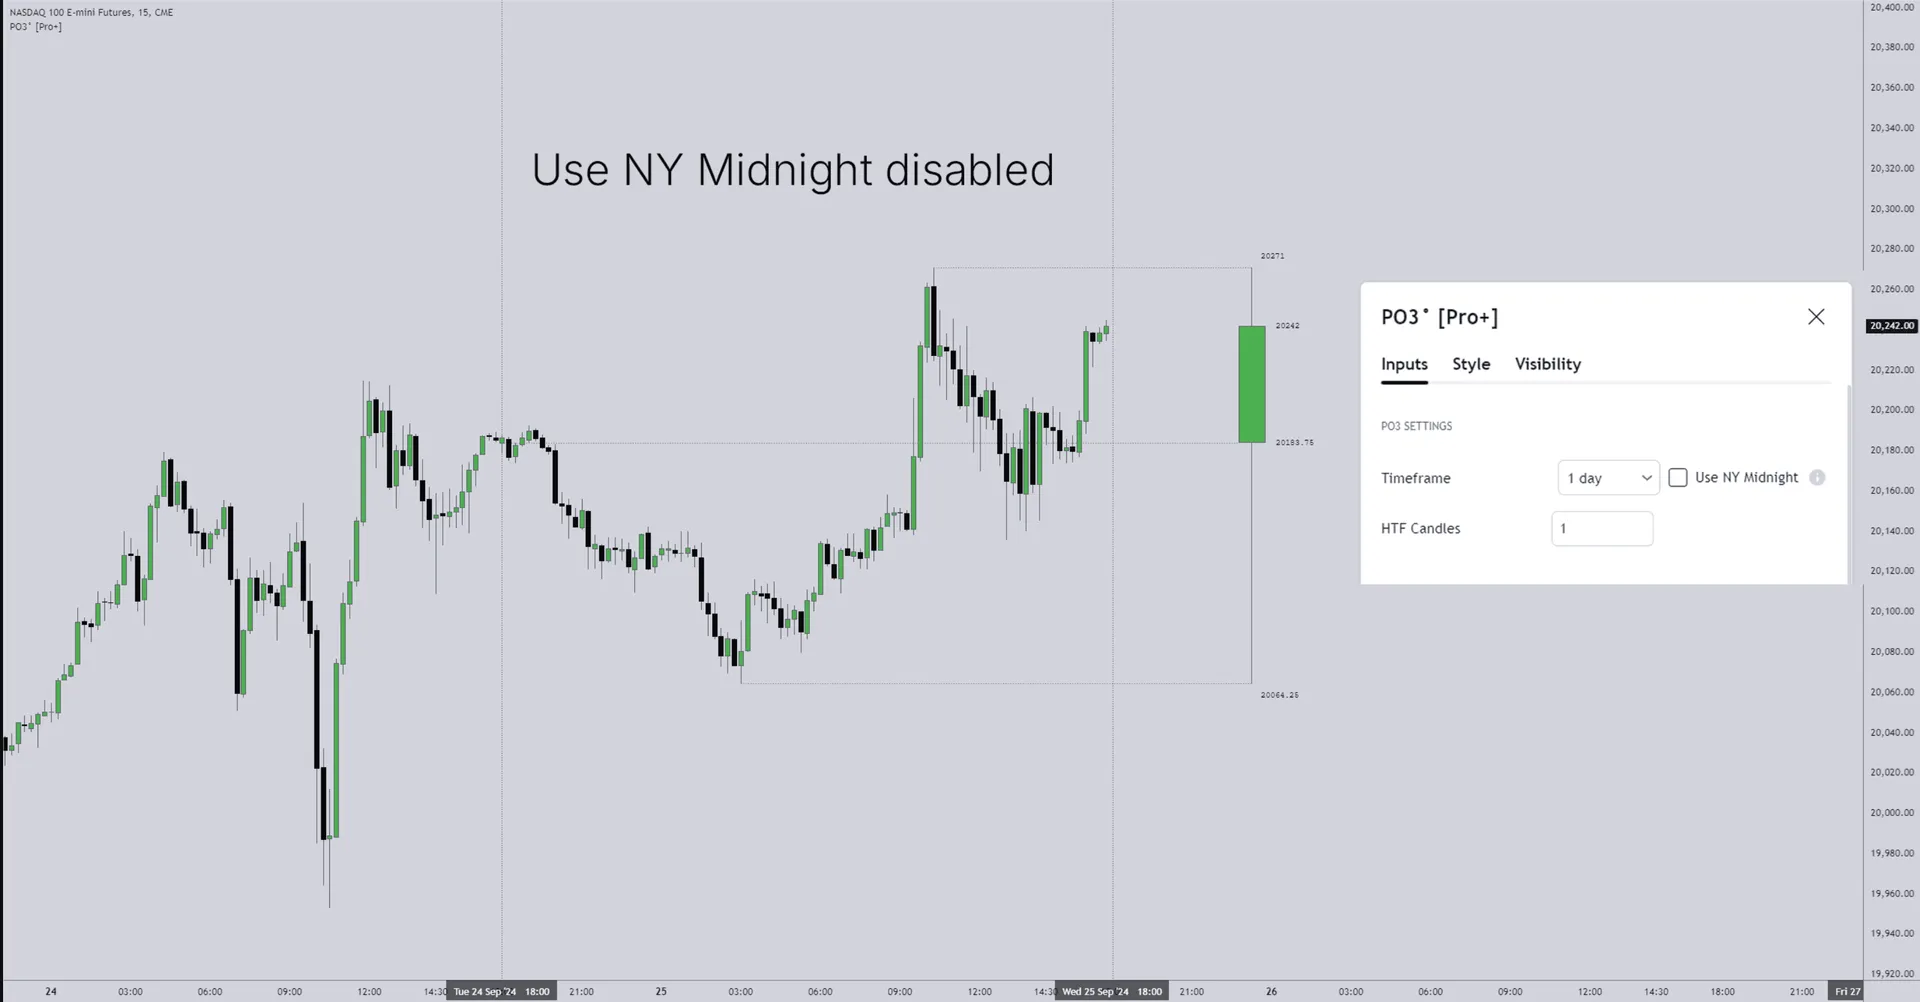
HTF Power Of Three° [Pro+] takes the developing higher timeframe candle and draws it directly on your execution chart, so you watch accumulation, manipulation and distribution happen while price is still delivering. No second layout, and no waiting for the close.
The candle sits beside your low timeframe view with its open, high and low plotted as live levels, and a countdown timer tells you how long is left before it closes. Your PD Arrays stay in view the whole time. You can plot as many HTF candles as you need and stack instances to watch several higher timeframes on one chart.
A few settings are worth knowing. Use NY Midnight anchors the open to midnight New York for daily and weekly candles. You can switch between candles and bars, resize and offset them to suit your layout, and hovering a past candle brings back its full OHLC and range values.
Your framework. Our automation.
Intra-Bars: the story inside the candle
Turn on Show Intra Candles and the tool draws Intra-Bars inside each HTF PO3 candle. Those are the actual lower timeframe candles that build the higher timeframe structure, sitting right next to the main candle.
Now the inside of the candle is legible while it forms. You can watch price coil, stall and finally break, all inside the developing HTF candle, without dropping to a lower timeframe and picking up the tunnel vision that comes with it.
PO3 Volume: who actually showed up
By default your volume bars measure your chart timeframe, which tells you nothing about the candle setting your bias. Show PO3 Volume Bars re-aggregates volume per PO3 candle instead, and Show Intra Volume Bars does the same for the Intra-Bars. Drop Show Volume MA over either one and you are reading relative participation across the phases instead of guessing at it.
That is how you separate a real expansion from a limp one. Heavy participation arriving as price finally distributes means something different from a move that expands on nothing. The tool plots the participation. Reading it is your job.
One quirk from the manual: flipping SET on or off can shift the volume numbers, because aggregation depends on how the PO3 candle session boundaries are defined. That is expected behaviour, not a bug.
Pair it with Average Range Levels
PO3 tells you which phase the higher timeframe is in. It does not tell you how much room the move has left, and that is where Average Range Levels° [Pro+] comes in. ARL maps where price statistically tends to reach in a session or period and flags when a move has pushed past its typical range into extended territory.
Run them together and you answer two questions at once: which act is playing out, and how much of the average range is already spent. An expansion that starts with most of the day range still available is a very different proposition from one starting with the range nearly gone. Neither number predicts anything. It is context you would otherwise be holding in your head.
How to trade HTF Power of Three live
The workflow is simple. Read the phase first, then execute.
If the higher timeframe is still accumulating, there is nothing to do yet. If it is in manipulation, that push against you now has a name and you stop mistaking it for a breakout. Once it is distributing, your entries are finally going with the delivery instead of leaning into it.
It will not call the next candle for you. What it does is show which phase the higher timeframe is actually in, so you stop arguing with the context and start trading alongside it. Context, not a signal.
Key Questions
You can, but only the closed candle is readable that way. The phase you need to act on is the one still forming, and switching layouts mid-delivery costs you the execution view. HTF Power of Three keeps both on one chart.
The HTF candle is the developing higher timeframe candle. The Intra-Bars are the lower timeframe candles that build it, plotted alongside it, so the internal development of each phase stays visible without changing chart resolution.
Standard volume is aggregated per chart candle, which describes your execution timeframe rather than the candle setting your bias. Aggregating per PO3 candle lets participation be compared across the accumulation, manipulation, and distribution phases.
What HTF Power Of Three° [Pro+] Plots
| Feature | What It Shows | Why It Matters |
|---|---|---|
| Developing HTF candle | The higher timeframe candle forming live on your execution chart | Read context without switching layouts or waiting for a close |
| HTF open / high / low | The current HTF candle's open, high and low as live levels | Stop marking the HTF open by hand |
| Countdown timer | Time remaining until the HTF candle closes | Know how much of the story is left |
| Intra PO3 (Intra-Bars) | The LTF candles building the HTF structure, drawn beside it | See consolidation, expansion or stalling inside the candle |
| PO3 Volume Bars | Volume aggregated per PO3 candle, plus a Volume MA | Compare participation across the three phases |
| Stacked instances | Multiple higher timeframes plotted at once | One chart instead of several layouts |
Come read the phases live
We read higher timeframe phases live every session in the free Toodegrees Discord. Come trade context with us.
Frequently Asked Questions
No. None of our indicators repaint. The developing HTF candle updates live as price forms it, which is the point, but the plotted phases and the HTF open, high and low don't redraw historically once set.
Set the HTF to the timeframe your framework already uses for bias, and keep executing on the one you already trade. The point is seeing both without switching. Stack instances if you want more than one higher timeframe at a time.
No. It visualizes the phases of a developing higher timeframe candle. Tools, not signals. It does not call the next candle, it shows which phase the higher timeframe is in.
No. That is the reason it exists. The developing HTF candle is plotted onto your execution chart, and you can stack instances to show several higher timeframes at once.
Yes. It is built to be used in TradingView Replay Mode for studying and backtesting PO3, and you can backtest with two or more timeframes on one chart.
HTF Power of Three is one of our in-house tools. It is included in the Premium Suite and the Elite Collection, and it is available standalone. Fulfilment is on Whop.
Continue Reading
Ready to Automate Your Analysis?
Join 30,000+ traders using Toodegrees indicators to save time and find higher-probability setups.