January 2026 EOM Report: Inter Market Dynamics
Written by
A Sign Of Time
Head of Education & Toodegrees Analyst
Section 1
Monthly Recap: HTF Power Of Three Dashboard
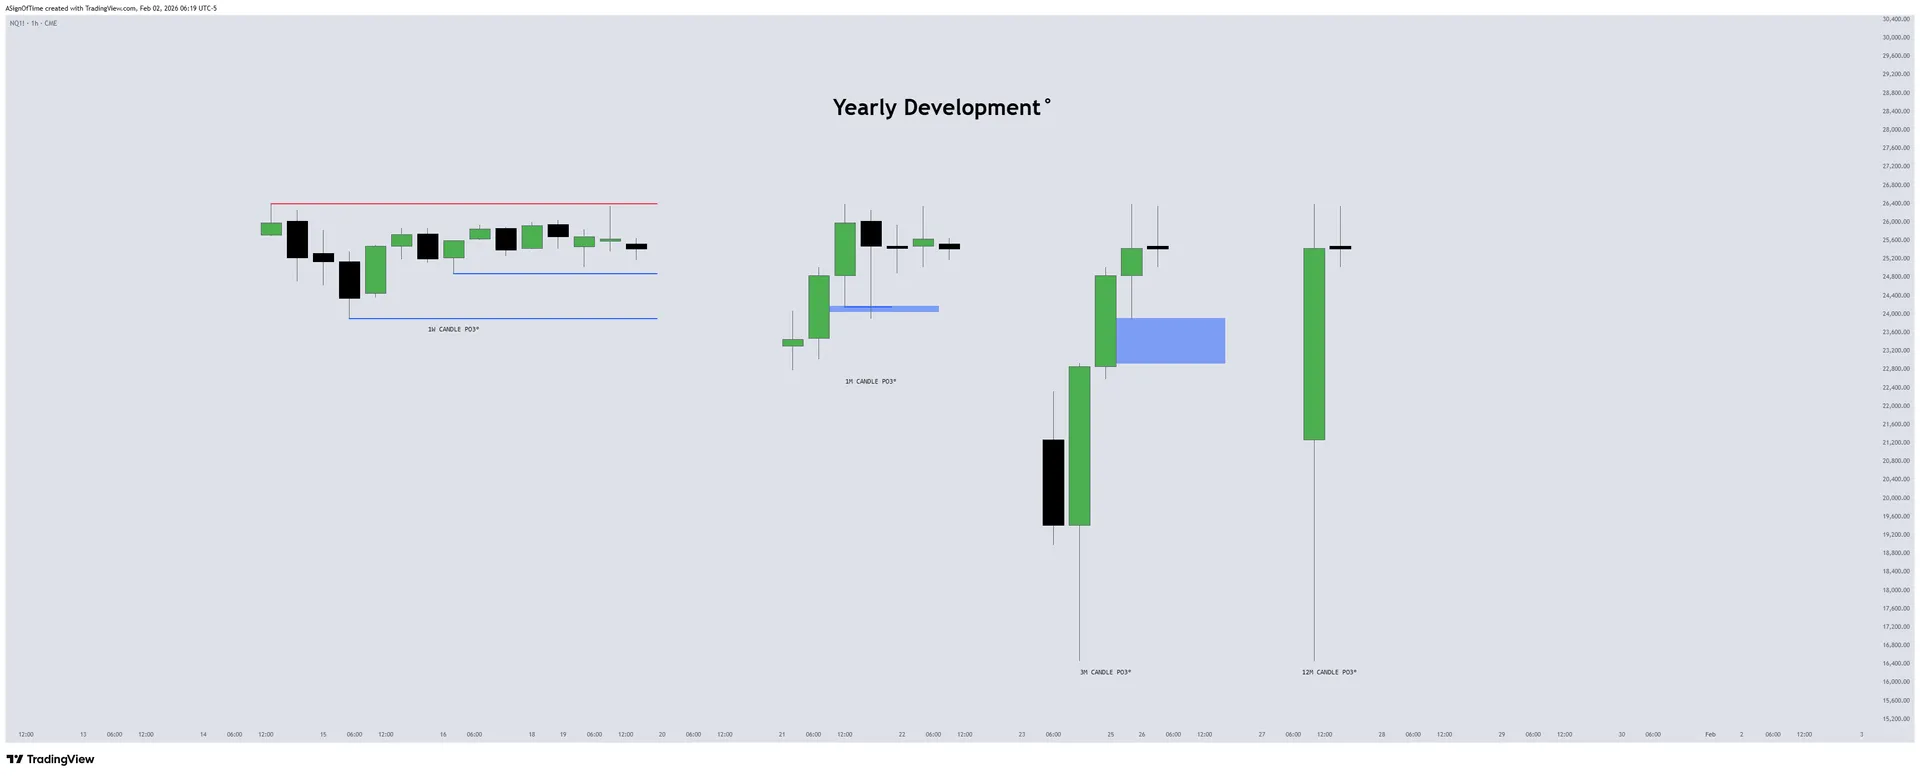
Welcome to the January End-of-Month Market Recap. The higher-timeframe structure on $NQ continues to reflect an orderly yearly development. Across the 1W, 1M, 3M, and 12M candles, price remains aligned with the broader Power of Three framework, with key points of interest continuing to guide market behavior. January price action respected higher-timeframe structure, with pullbacks remaining contained.
Price traded into discount relative to recent ranges without violating key structural lows, and no higher-timeframe candle body closures occurred below major reference levels.
Despite short-term volatility, the broader structure remains constructive. Price continues to operate within the parameters of a controlled yearly expansion, with higher-timeframe behavior suggesting consolidation rather than distribution at this stage.
NQ Futures: Higher-Timeframe Structure
Analyst Insight
January's containment within the broader range is a constructive sign. No higher-timeframe body closures below key reference levels confirms institutional support is still present. The yearly development remains intact, watch for a breakout from the current consolidation zone to confirm the next directional leg.
Section 2
Technical Analysis: Nasdaq 100 E-Mini Futures
NQ Futures
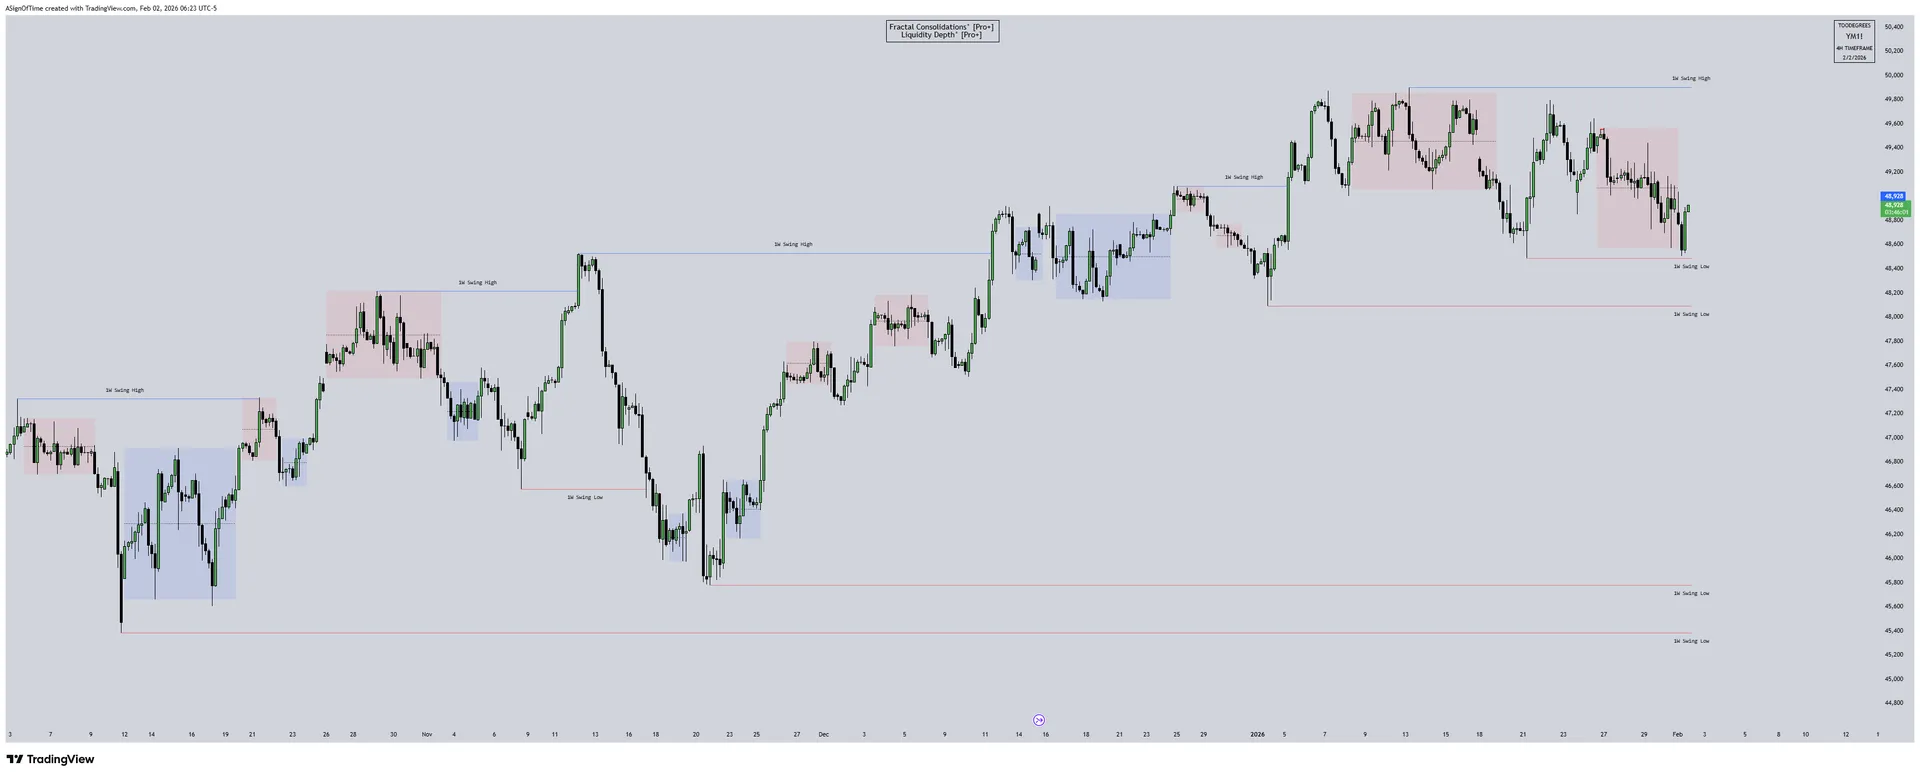
During January, $NQ continued to trade within a broader higher-timeframe range, with upside attempts failing to achieve sustained acceptance. Price repeatedly tested toward the upper boundary of the range but was met with rejection, signaling limited upside momentum rather than impulsive expansion.
Despite the lack of follow-through higher, the broader structure remains constructive. Pullbacks throughout the month were orderly and respected key support levels, with no confirmed higher-timeframe breakdown. Price action continued to align with a consolidation phase rather than distribution, as liquidity was absorbed on both sides of the range.
As long as $NQ remains above recent structural lows, the technical outlook stays intact. A decisive acceptance beyond the range high would be required to signal renewed strength, while a sustained loss of range support would be needed to invalidate the current bullish structural bias.
Section 3
Technical Analysis: Stat Map (NQ)
NQ Futures
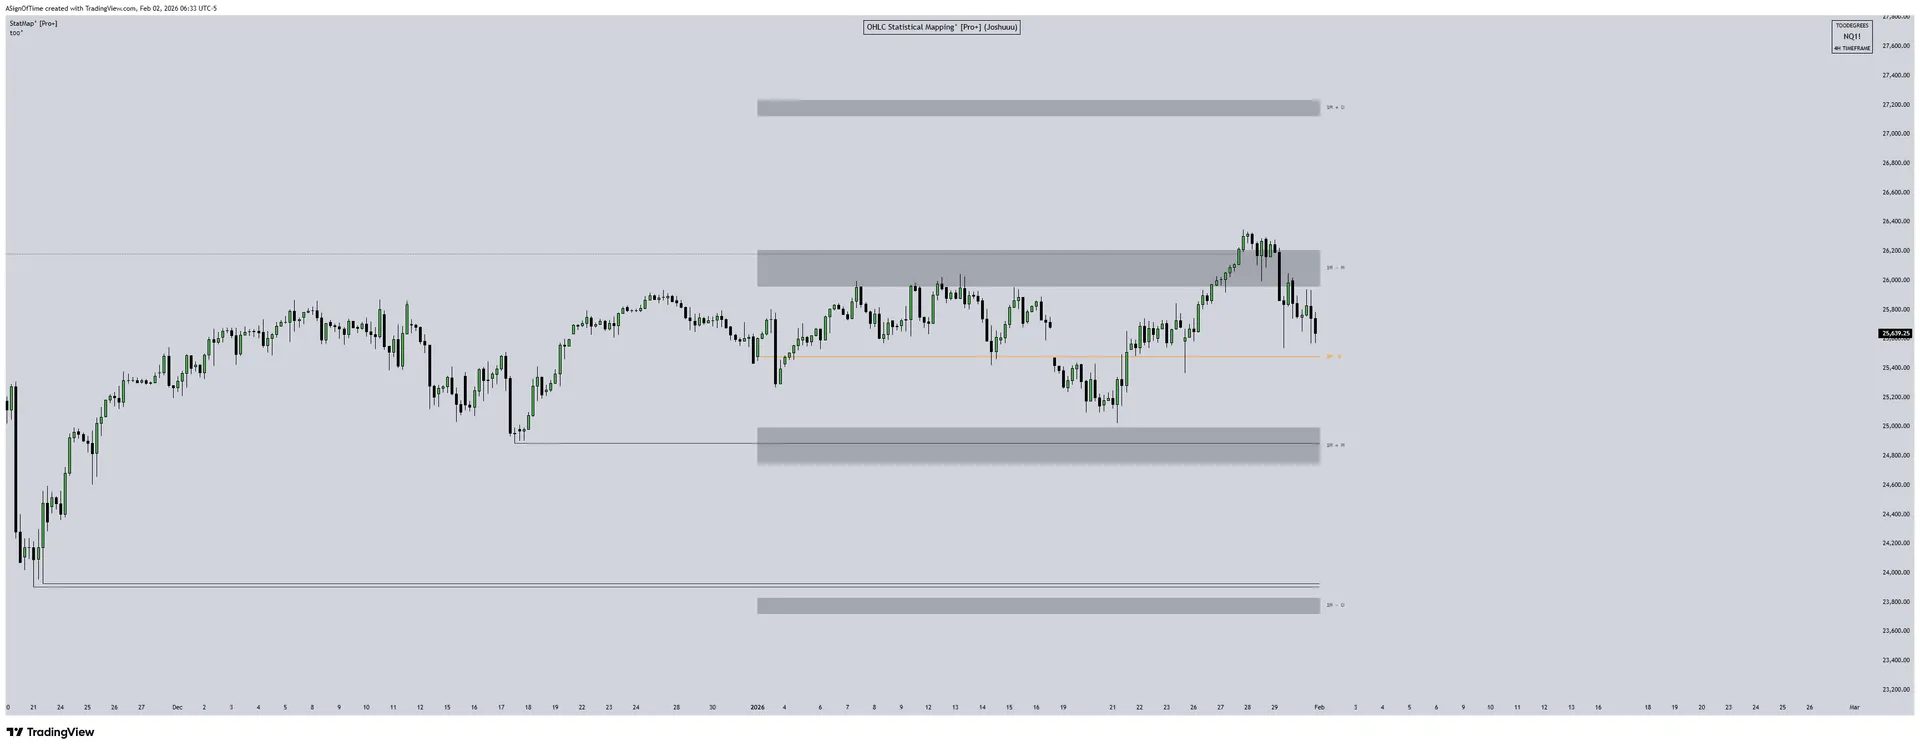
On this NQ chart, the StatMap is plotted using the 1-Month Timeframe with a combined calculation method (Both Median and Mean).
During January, price action remained rangebound between the bullish and bearish manipulation levels, with neither side achieving sustained acceptance. Upside extensions stalled around the bearish manipulation zone, while downside probes held above the bullish manipulation level, reinforcing a balanced and rotational market state.
Price spent the majority of the month rotating around the opening price, signaling equilibrium rather than directional expansion. Attempts to transition into distribution were met with rejection, resulting in continued containment within the broader statistical range.
Section 4
Monthly Recap: HTF Power Of Three Dashboard (DXY)
HTF Power Of Three Dashboard
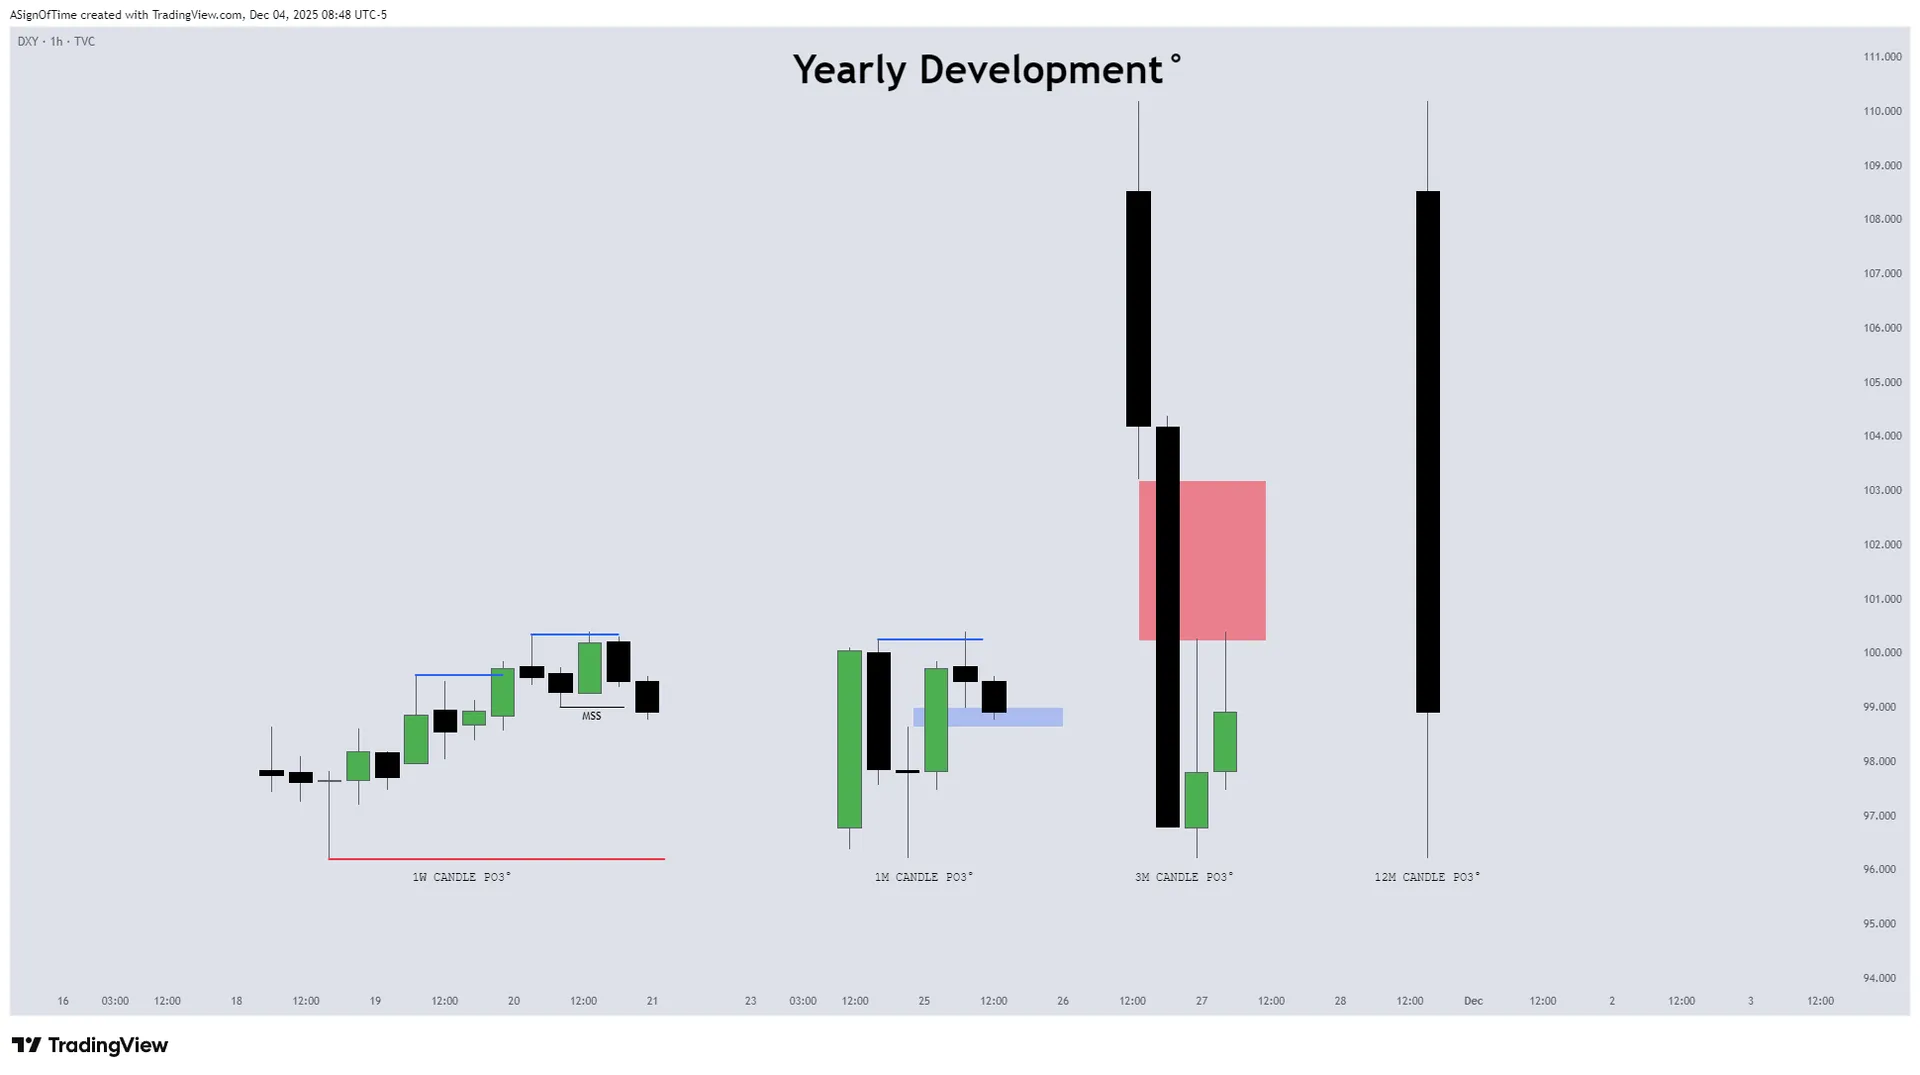
On the Quarterly timeframe, DXY reached its primary upside objective by trading into the Quarterly Fair Value Gap, completing the draw on higher-timeframe liquidity that had been developing over several months. Following this interaction, price began to rotate lower, with late-January down-close candles signaling a shift away from the prior advance and a loss of upside momentum.
On the weekly chart, the reaction presents as a smaller consolidation candle forming just beneath the quarterly imbalance. This positioning suggests the dollar is beginning to transition away from the Fair Value Gap, though confirmation of continuation lower has not yet occurred. A clean break and acceptance below recent weekly lows would support this transition and better align the monthly structure with a broader distribution phase to the downside.
US Dollar Index (DXY)
Section 5
Technical Analysis: Stat Map (DXY)
US Dollar Index: Statistical Mapping
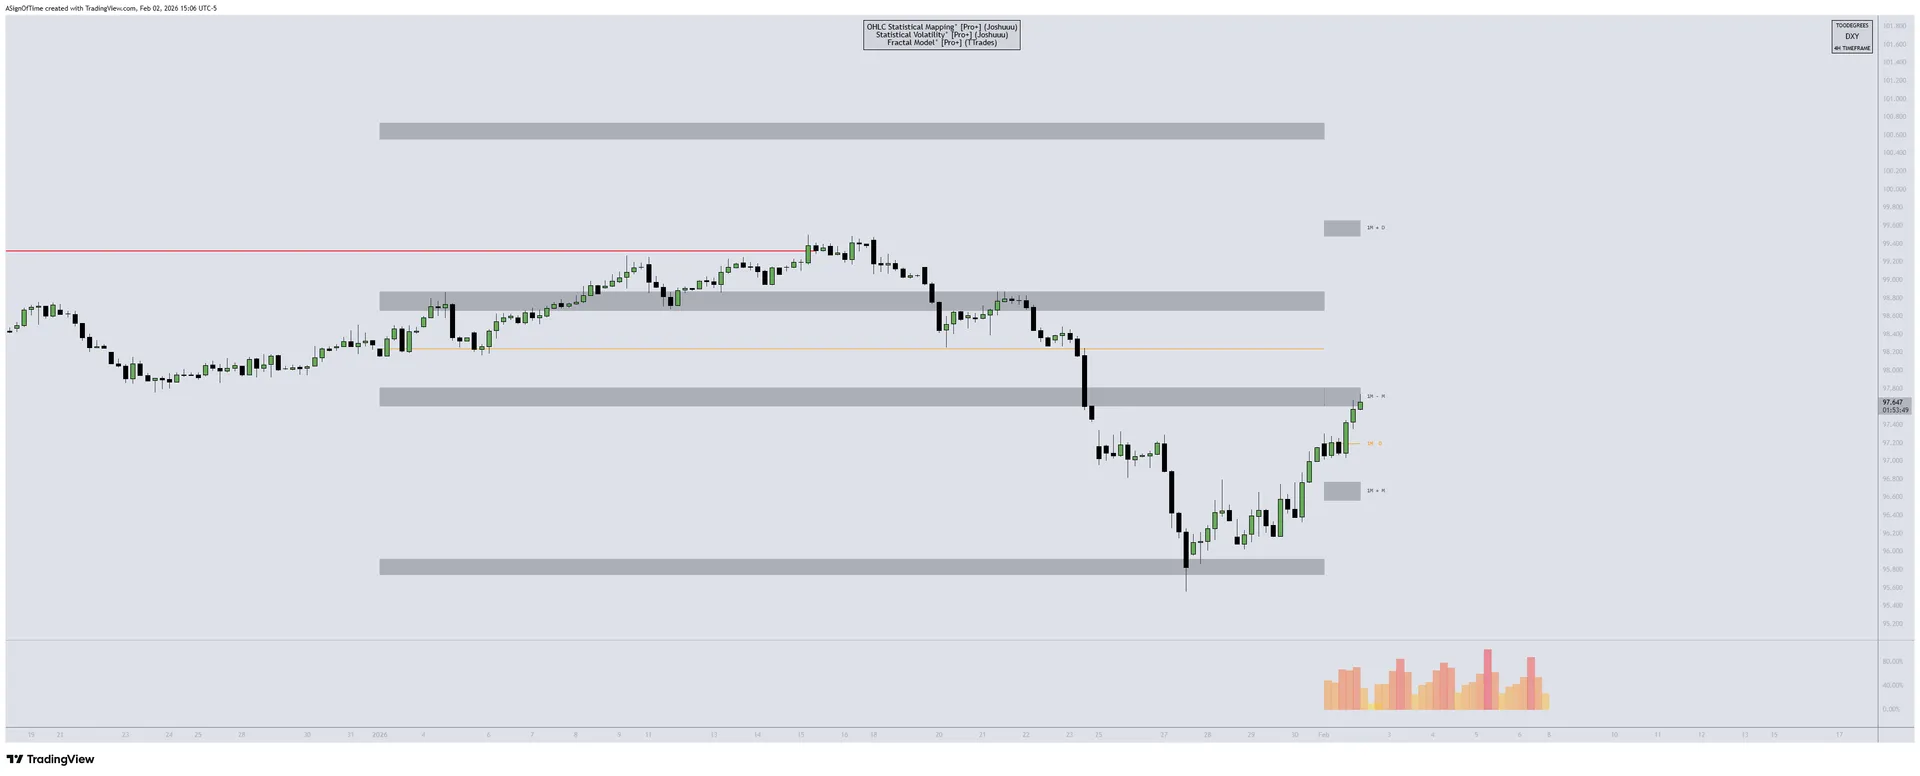
The 1-month statistical map shows that DXY operated within a clearly defined short-term range, with price responding to statistical manipulation and distribution levels.
In January, DXY traded just above the bearish manipulation level, where a brief push higher took out buyside liquidity but failed to gain acceptance. This move marked an exhaustion of the upside move rather than sustained strength.
Price then reversed lower, moved back through the bearish manipulation level, and rejected it, confirming a loss of upside control. Following this rejection, DXY expanded lower with speed toward the bearish distribution level, moving efficiently through the statistical range.
Section 6
Inter-Market Dynamics
A quick overview of all three asset classes, NQ, DXY, and T-Bonds, tracking orderflow, seasonality, open interest, market condition, COT positioning, and interest rate context as of January 2026.
| Metric | NQ | DXY | T-Bonds |
|---|---|---|---|
| Orderflow | Bearish → Bullish | Neutral → Bearish | Bearish → Bullish |
| Seasonality | Bullish → Sideways | Bullish → Bearish | Bullish → Sideways |
| Open Interest | Rising | Declining | Declining |
| Market Condition | Consolidating | Consolidating | Expanding |
| COT Report | Net Short | Net Short | Net Long |
| Interest Rate | — | — | 3.75% to 4.00% |
Analyst Insight
The inter-market snapshot for January highlights a market in transition. NQ orderflow shifted from bearish to bullish while remaining in consolidation, a sign of accumulation. DXY's neutral-to-bearish orderflow aligns with the Quarterly FVG reaction seen in the HTF analysis. T-Bonds expanding with net long COT positioning reflects a bid for safety, consistent with broader uncertainty.
Section 7
Conclusion: Analysis Recap
February reflected a market environment defined by corrective pressure and selective repricing rather than broad expansion. Across asset classes, movements were driven by rotation and recalibration rather than synchronized trend continuation.
U.S. equities largely declined during the month, with prior momentum fading and price compressing back into higher-timeframe ranges. The pullback appeared rotational rather than disorderly, as volatility remained contained and structural support levels held. Seasonal tendencies provided context, though geopolitical tensions continue to add macro sensitivity.
In FX, the U.S. Dollar retraced higher after setting a late-January low, trading back into prior weekly liquidity pools. However, declining Open Interest suggests the advance was driven more by short covering than aggressive new positioning, while EUR and GBP reflected relative weakness within corrective structures.
Rates markets saw coordinated repricing across the Treasury curve, led by intermediate maturities. The yield curve continues its gradual normalization, with the front end anchored and the long end elevated due to persistent term premium and fiscal uncertainty.
Overall, February reinforces the view of markets operating within a broader transition phase. As March unfolds, attention shifts toward liquidity dynamics and macro catalysts that may determine whether corrective moves evolve into sustained directional expansion.
Featured Indicator