Liquidity Pools Indicator for TradingView Explained
Written by
A Sign Of Time
Head of Education & Toodegrees Analyst
Key Summary
- Resting liquidity has two meanings: live order-book heatmaps, and price-structure pools that sit above prior highs and below prior lows. This guide covers the price-structure reading used in ICT and smart money concepts.
- Buy-side liquidity rests above prior highs and sell-side liquidity rests below prior lows, because stop orders cluster at both.
- Marking these pools by hand is slow and subjective, which is why traders look for a liquidity pools indicator for TradingView.
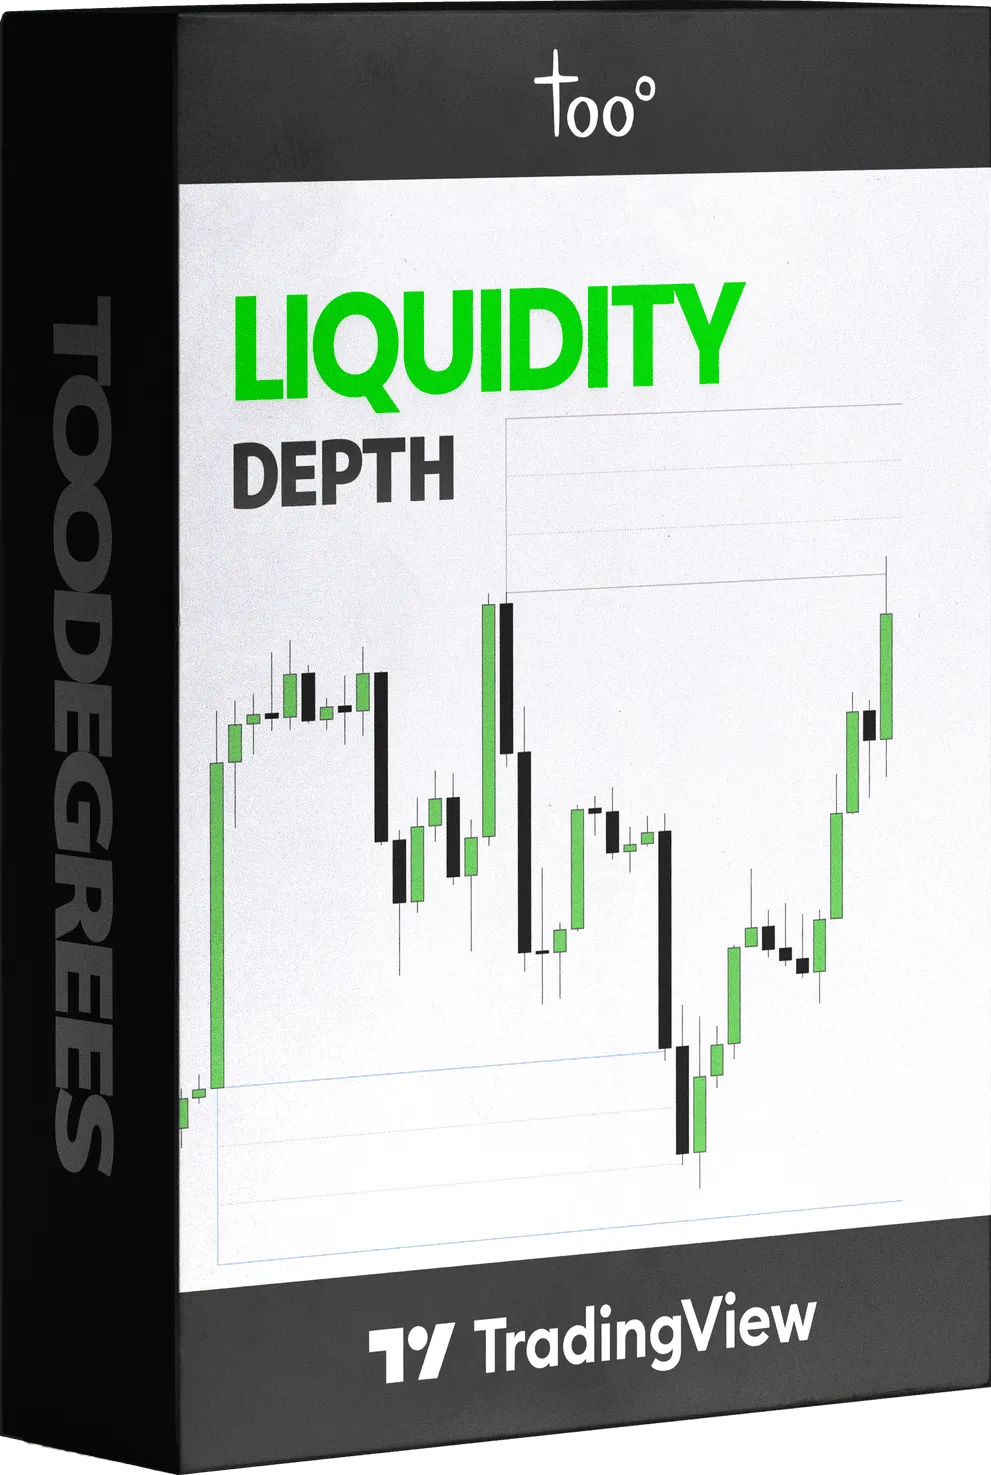
- Liquidity Depth° [Pro+] plots the pools above highs and below lows, projects how deep each may run, and lists the exact levels in a Liquidity Table.
Two meanings of resting liquidity
Resting liquidity describes orders waiting in the market, not yet filled. Traders use the phrase two ways. The first is the live order book, shown as a depth-of-market heatmap of resting limit orders that changes tick by tick. The second is a price-structure reading, where liquidity rests at obvious chart levels such as prior highs and prior lows because stop orders collect there.
This guide covers the second reading, the one used in ICT and smart money concepts. ICT is the Inner Circle Trader methodology, and smart money concepts describe how large institutional orders interact with price.
What resting liquidity pools are
A resting liquidity pool is a price area where pending orders concentrate, most often just beyond a visible high or low. Buy-side liquidity rests above prior highs, where the stop orders of short sellers sit. Sell-side liquidity rests below prior lows, where the stop orders of buyers sit.
The most watched pools form at the prior day high and low, the prior week high and low, and the session extremes. Equal highs or equal lows, which are two or more highs or lows at almost the same price, make an especially deep pool because stops stack at the shared level.
Why price is drawn to these pools
Price often moves toward levels where many stop orders sit, because those orders provide the volume that large participants need to fill positions. When price trades into a pool and triggers the stops resting there, traders call it a liquidity sweep or a liquidity raid.
Knowing where the pools rest gives you structural context for where price may travel next. It does not predict the move. It shows the map.
Finding pools by hand, and why it is slow
You can mark liquidity pools manually using the prior day and week highs and lows, the session extremes, and any equal highs or lows. The method works, but it has costs.
You have to redraw the levels as each session and day complete, you have to decide which highs and lows matter, and the choice is subjective from one trader to the next. On lower timeframes the candidate levels multiply and the chart fills with lines. This is the gap a liquidity pools indicator is meant to close.
Which indicator maps resting liquidity pools
Liquidity Depth° [Pro+] is the Toodegrees indicator that maps resting liquidity pools on TradingView. It plots the deeper pools that institutional participants are likely targeting beyond simple swing highs and lows, above prior highs and below prior lows, from a reference timeframe you choose.
It projects how deep each pool may run using range-deviation logic, keeps up to 20 previous pools for context, and lists the exact levels in a Liquidity Table that recolours as price engages a high or a low. Alerts fire when price crosses a level, so you do not have to watch every chart. One of its Liquidity Types, OSFL, plots pools from the logic in ICT's One Setup For Life lecture from the 2023 mentorship.
It is part of the Premium Suite, the in-house Pro+ toolkit, and it is invite-only on TradingView. For the full mechanics, including Extension Type and Range Deviations, see the Liquidity Depth resources below. Toodegrees builds tools, not signals, so the indicator maps where liquidity rests and leaves the read to you.
Order-book heatmaps or price-structure pools?
Both answer the question of where liquidity is, but they are different tools. An order-book heatmap shows live limit orders and changes constantly, which suits very short-term order flow. Price-structure pool mapping shows where stops rest at chart levels, which suits structural bias and targeting.
If you trade ICT or smart money concepts, the price-structure reading is the one you want, and it is what Liquidity Depth° maps. The comparison below lays out the trade-offs.
Key Questions
Liquidity Depth° [Pro+] by Toodegrees plots resting liquidity pools on a TradingView chart. It marks buy-side liquidity above prior highs and sell-side liquidity below prior lows, projects how deep each pool may run, and lists the exact levels in a Liquidity Table. It is a price-structure tool, not an order-book heatmap.
Order-book liquidity is the set of live limit orders shown as a depth-of-market heatmap, which changes tick by tick. Price-structure liquidity pools are the stop orders that collect at chart levels such as prior highs and lows. Liquidity Depth° maps the price-structure kind.
Buy-side liquidity rests above prior highs, where short sellers place their stop orders. Sell-side liquidity rests below prior lows, where buyers place theirs. Price often moves toward these pools because the clustered orders provide volume for larger participants.
Three Ways to Read Resting Liquidity
| Approach | What It Shows | Best For | Trade-off |
|---|---|---|---|
| Manual chart marking | Levels you draw by hand | Learning the concept | Slow and subjective, needs redrawing |
| Order-book / DOM heatmap | Live resting limit orders | Very short-term order flow | Changes constantly, not a structural map |
| Price-structure pool mapping | Pools above highs and below lows | Structural bias and targeting | Depends on the reference timeframe you choose |
Toodegrees builds tools, not signals. Liquidity Depth° maps where liquidity rests and how deep price may travel to reach it, then leaves the read to you.
Come read the levels live
We mark liquidity and trade the context live every session in the free Toodegrees Discord.
Frequently Asked Questions
No. An order-book heatmap shows live limit orders in the depth of market and changes tick by tick. Resting liquidity in the ICT sense is the stop orders that collect at chart levels such as prior highs and lows. Liquidity Depth° maps the second kind.
Start with the prior day and week highs and lows, the session extremes, and any equal highs or lows, since stops cluster at those levels. Liquidity Depth° draws these pools for you and projects how deep each may run.
Liquidity Depth° [Pro+] maps liquidity pools above prior highs and below prior lows. It is part of the Premium Suite and is invite-only on TradingView.
Continue Reading
Ready to Automate Your Analysis?
Join 30,000+ traders using Toodegrees indicators to save time and find higher-probability setups.