March 2026 EOM Report: Inter Market Dynamics

Written by
A Sign Of Time
Head of Education & Toodegrees Analyst
Section 1
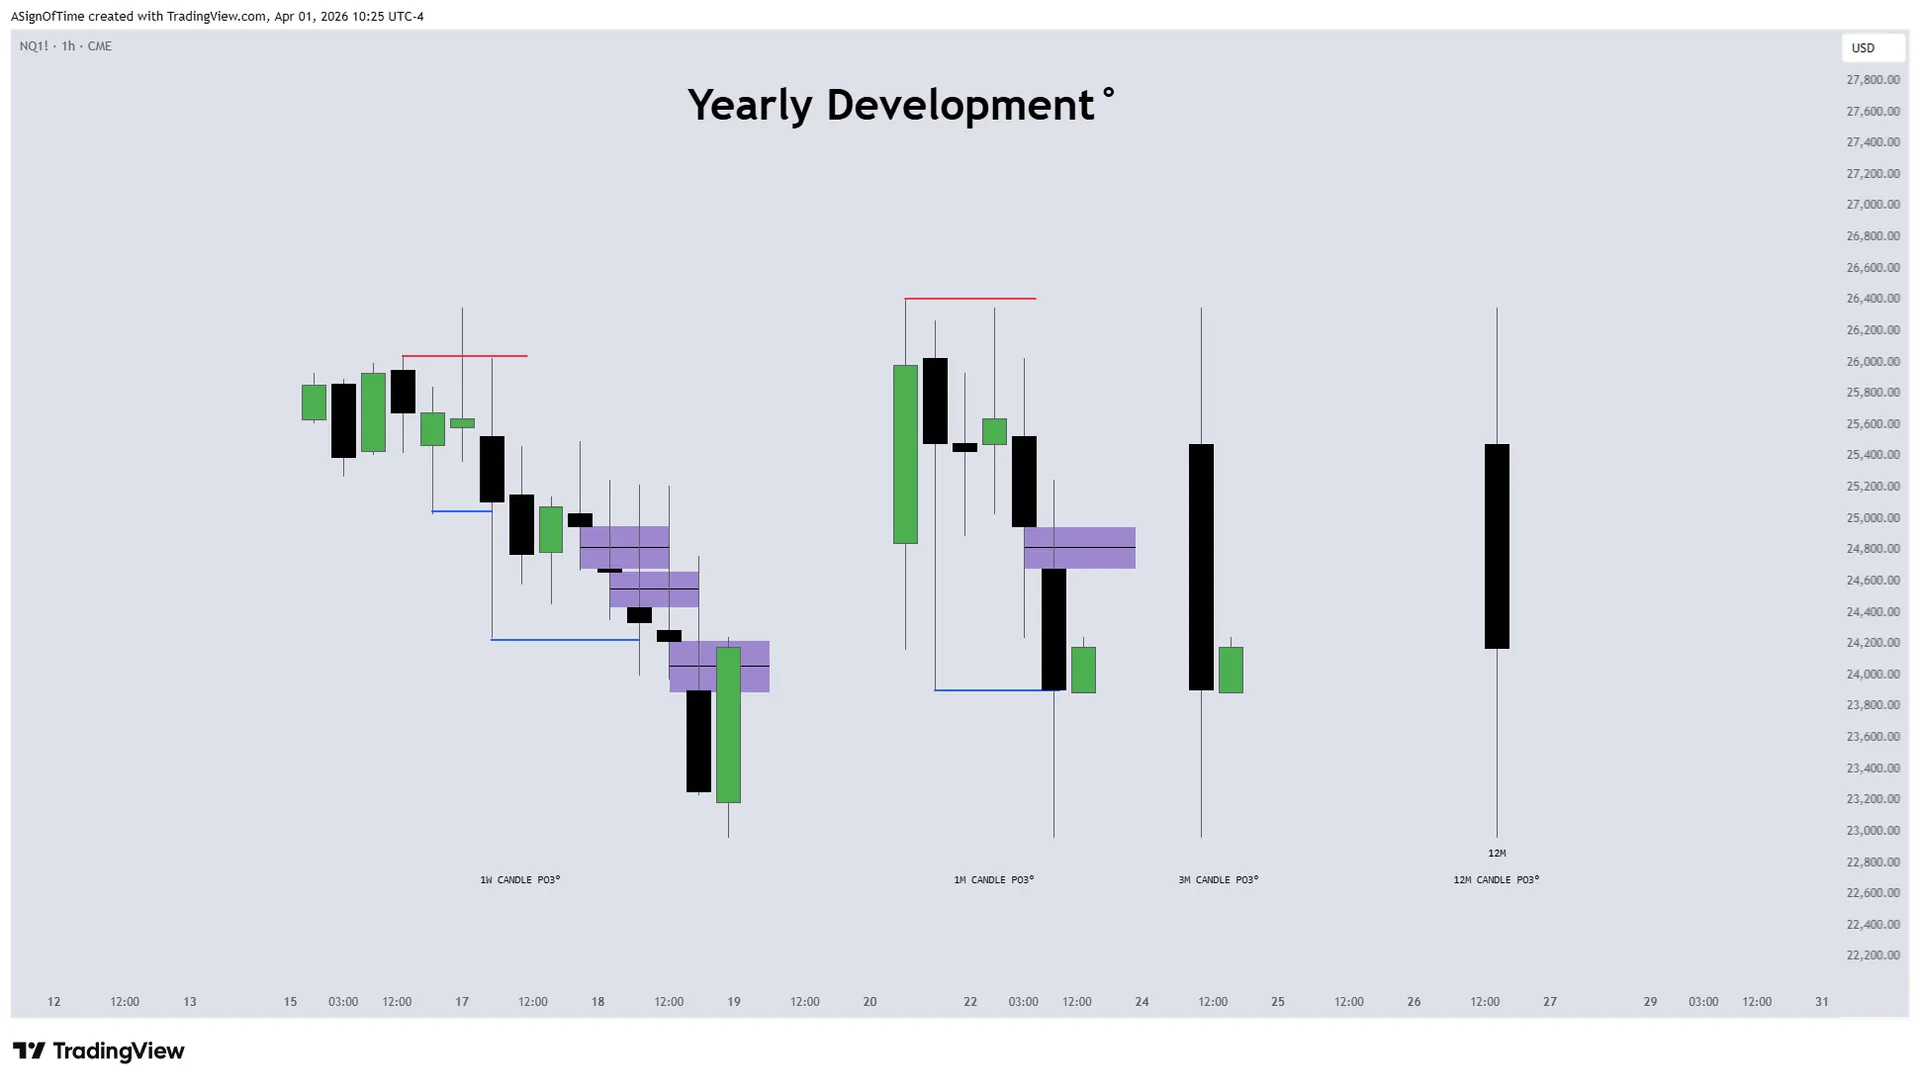
Monthly Recap: HTF Power Of Three Dashboard (NQ)
HTF Power Of Three Dashboard
The higher-timeframe structure on $NQ shifted during March, with price moving deeper into discount relative to recent ranges. Across the 1W, 1M, 3M, and 12M candles, the move reflects a transition from controlled expansion into a more pronounced retracement within the broader yearly framework.
Price traded through prior reference levels and tapped into lower PD arrays, marking a clear drawdown phase. The move below recent equilibrium levels indicates that price is now engaging with deeper liquidity, rather than holding within premium or mid-range conditions.
Despite the displacement lower, the broader structure remains intact. The late-month reaction from discount suggests responsive buying, with price beginning to rebalance after the sell-side liquidity sweep.
Higher-timeframe behavior now reflects a corrective phase within the yearly expansion, with current conditions pointing toward consolidation or retracement rather than confirmed structural breakdown.
Nasdaq 100 Futures ($NQ)
Analyst Insight
March's move into deeper discount is significant but not structurally bearish, no higher-timeframe framework has been violated. The late-month responsive buying from sell-side liquidity pools is the key signal to watch. If price can reclaim equilibrium on the monthly close, the yearly expansion thesis remains valid.
Section 2
Technical Analysis: Dow Jones E-Mini Futures
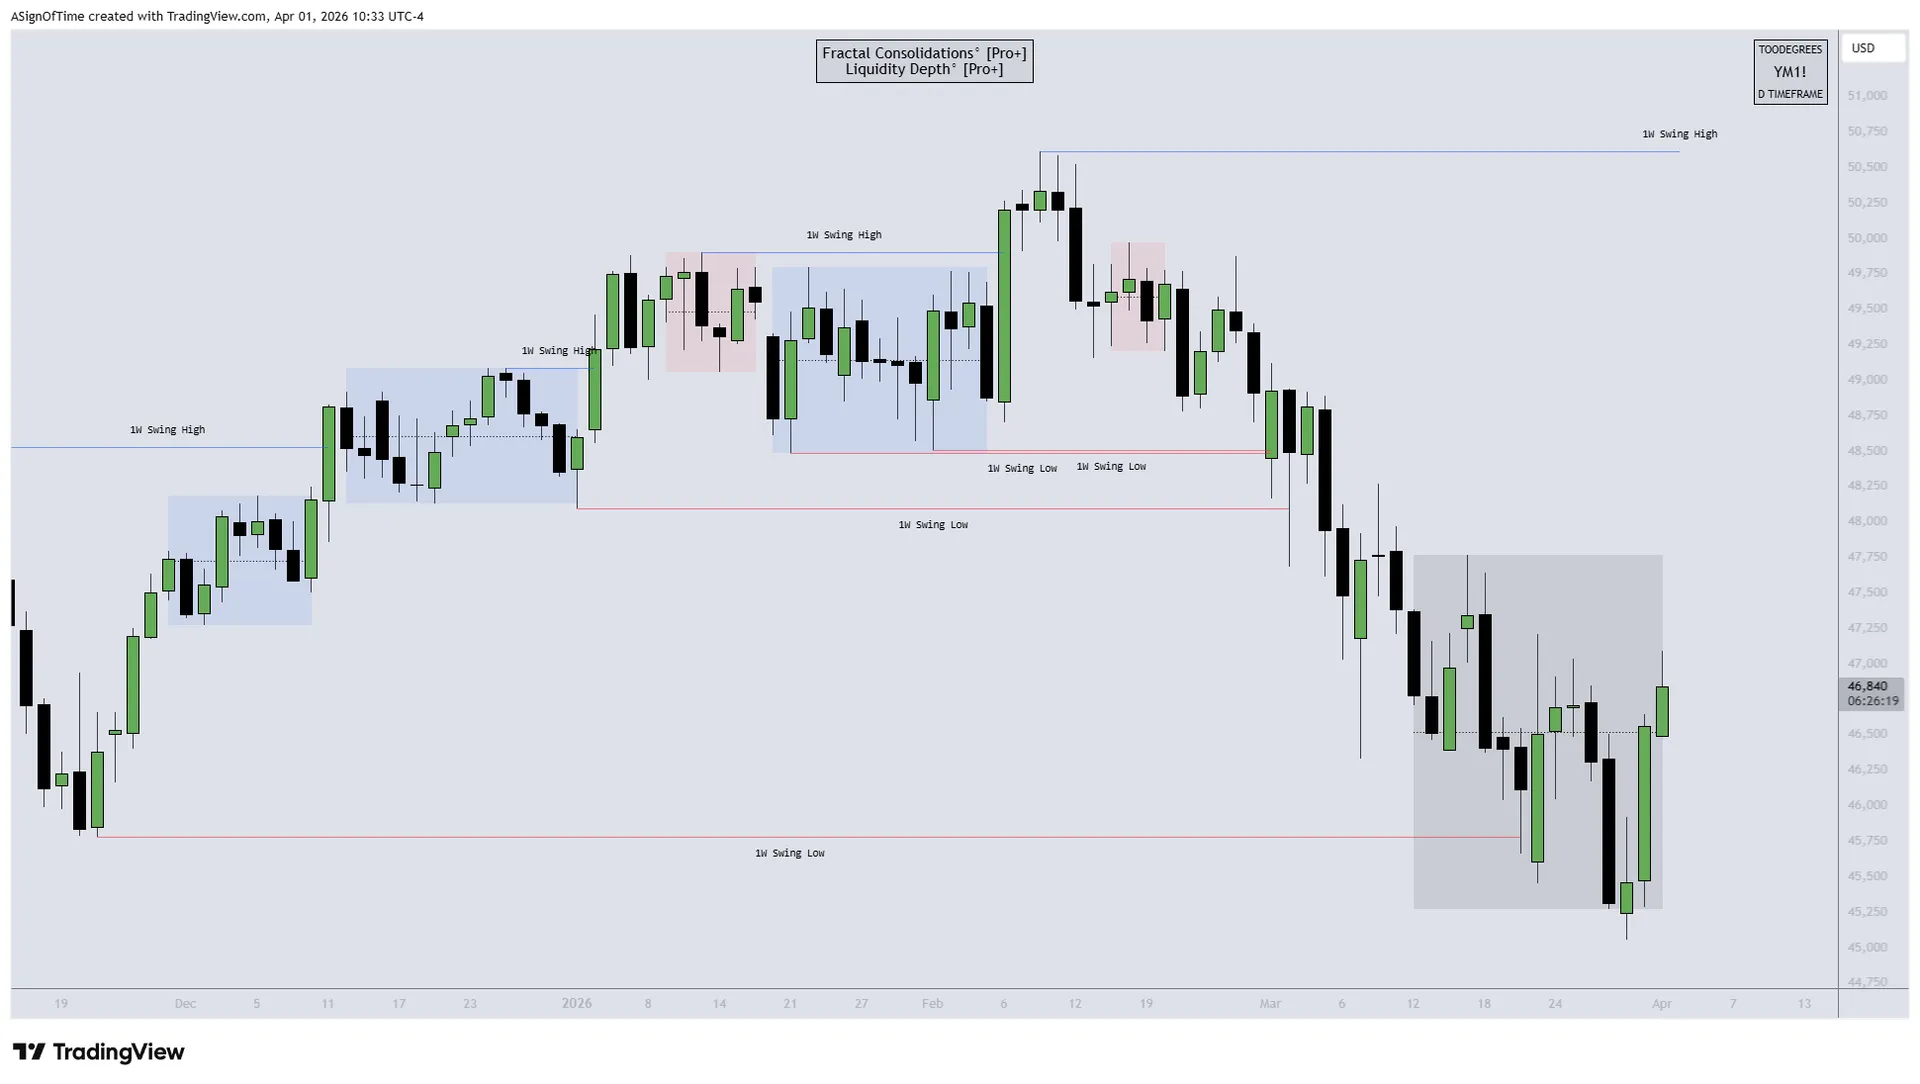
YM Futures
During March, $YM completed a Market Maker Sell Model on the daily timeframe, with price expanding lower after failing to hold within the prior weekly ranges. The sequence of lower highs and continued displacement lower confirmed bearish delivery, as price moved through multiple 1-week swing low reference points.
The key development came late in the month, when price traded below the lower 1-week swing low sell-side liquidity pool. That sweep completed the downside objective of the current framework and marked an important shift in context, as selling pressure began to slow after liquidity was taken.
Since then, price has started to react higher from that sell-side raid, producing the early stages of a possible V-shape reversal. At minimum, the current rebound suggests the market may be attempting to trade back into the previous range after completing the sell model.
For now, the bullish reaction remains early-stage and unconfirmed on a higher-timeframe basis. However, after completing the daily sell framework and sweeping the lower weekly liquidity, the focus shifts from continued downside expansion toward whether price can reclaim range levels and build a broader retracement.
Section 3
Technical Analysis With Stat Map: Nasdaq 100 E-Mini Futures
NQ Futures
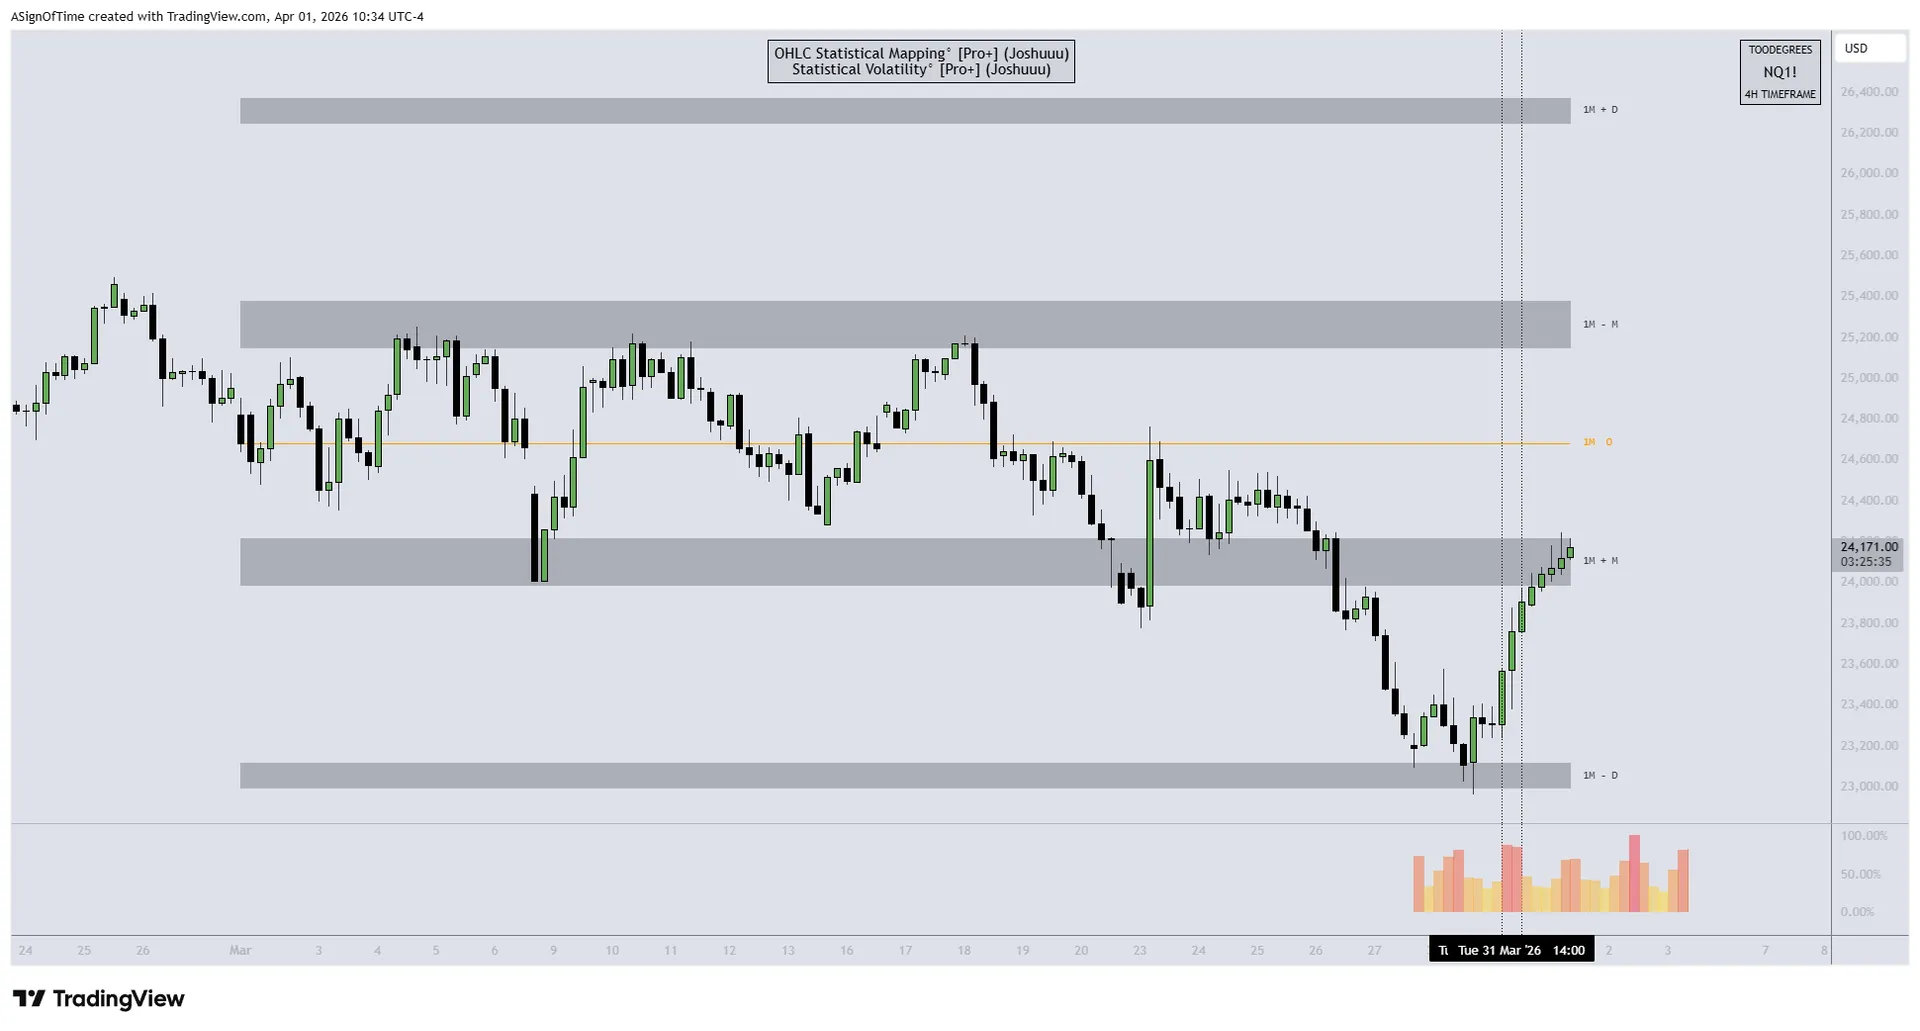
On this NQ chart, the StatMap is plotted using the 1-Month Timeframe with a combined calculation method (Both Median and Mean).
During the first three weeks of March, price consolidated between the manipulation levels, reflecting a balanced, rotational environment around the monthly mean.
In the final week, price broke lower out of this range and expanded directly into the bearish distribution level, aligning with the increase in downside momentum into month-end.
Overall, March reflects a shift from consolidation into bearish expansion, with the statistical framework clearly capturing both phases of price delivery.
Section 4
Monthly Recap: HTF Power Of Three Dashboard (DXY)
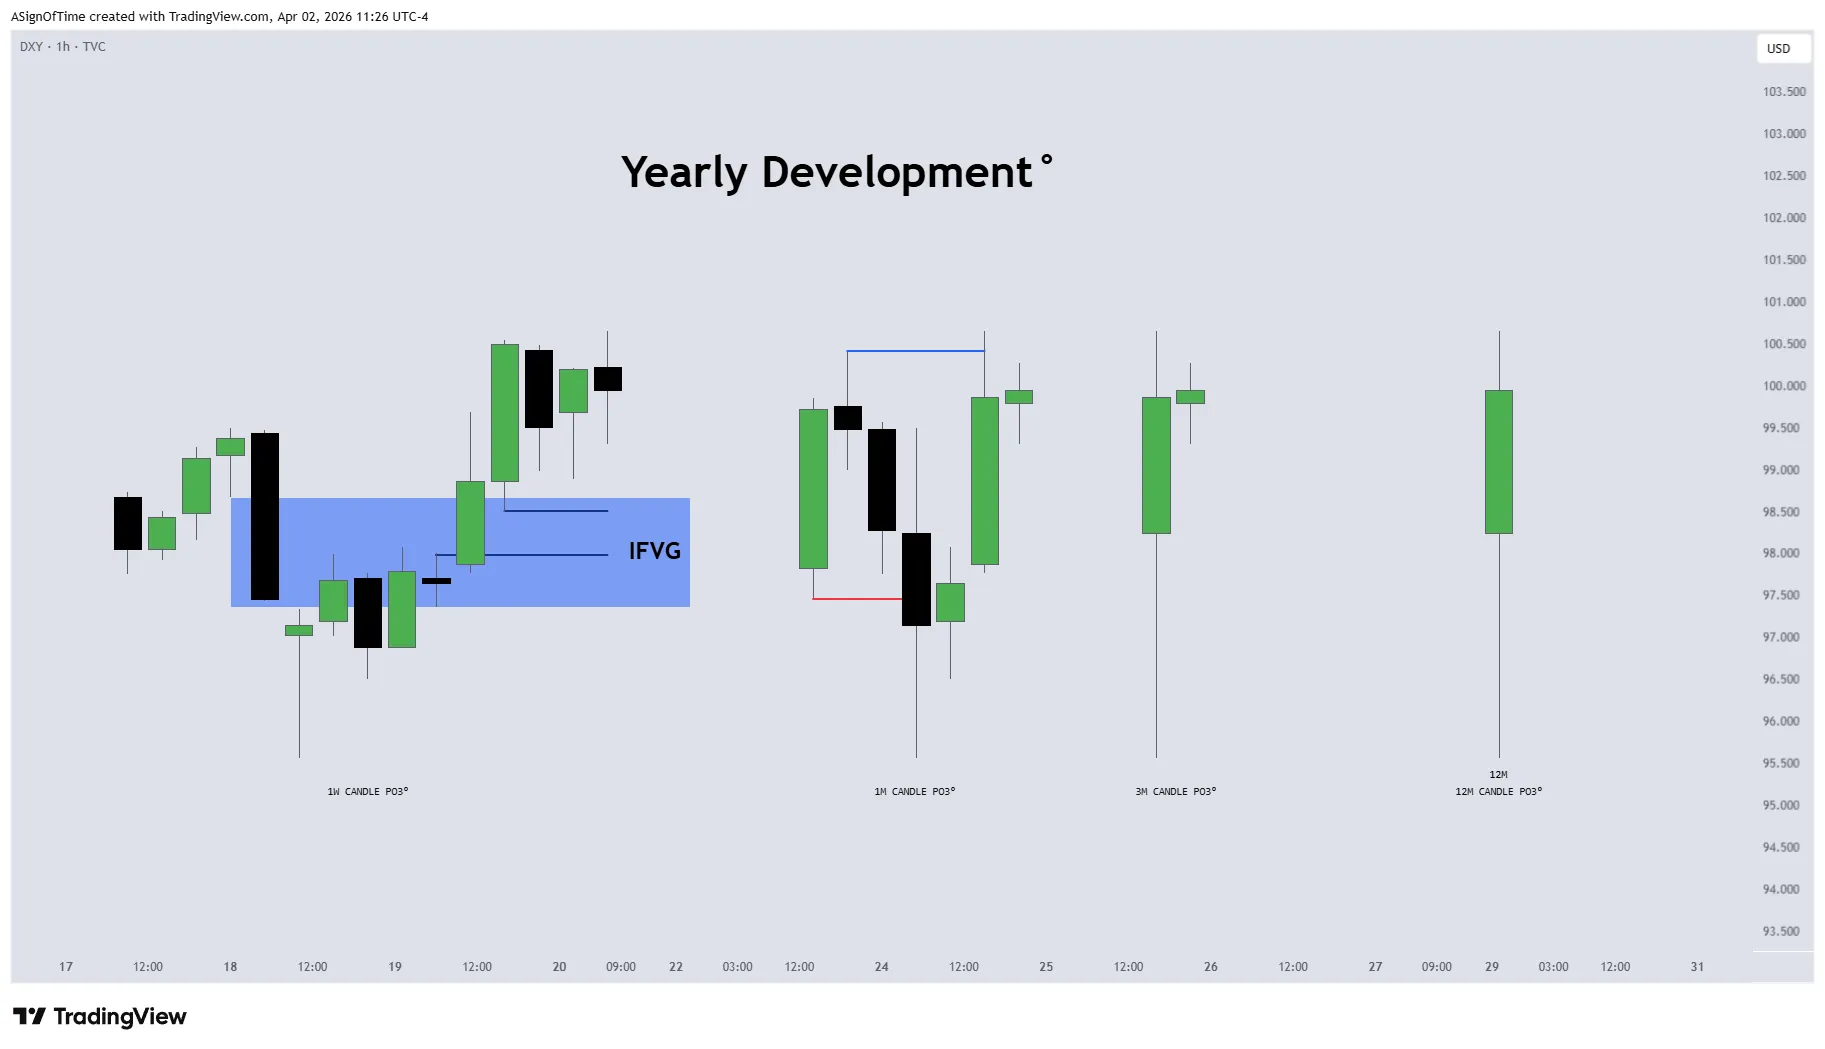
HTF Power Of Three Dashboard
March marked a clear shift in structure, as DXY transitioned from February's corrective recovery into impulsive expansion. Price displaced higher early in the month before delivering a sharp retracement, forming a deeper rebalancing phase within the broader yearly range.
Across the 1W and 1M candles, price traded from discount into premium, confirming expansion beyond equilibrium. However, the late-month pullback suggests a reaction after completing a short-term expansion leg rather than immediate continuation.
The 3M and 12M structures remain constructive, with price now positioned in the upper portion of the yearly range. This reflects strengthening higher-timeframe momentum despite increased short-term volatility.
Overall, March confirms a shift toward bullish continuation on the Dollar, with expansion achieved and current price action reflecting consolidation following displacement rather than structural weakness.
US Dollar Index (DXY)
Section 5
Technical Analysis: US Dollar Index Daily Chart
US Dollar Index: Market Maker Buy Model
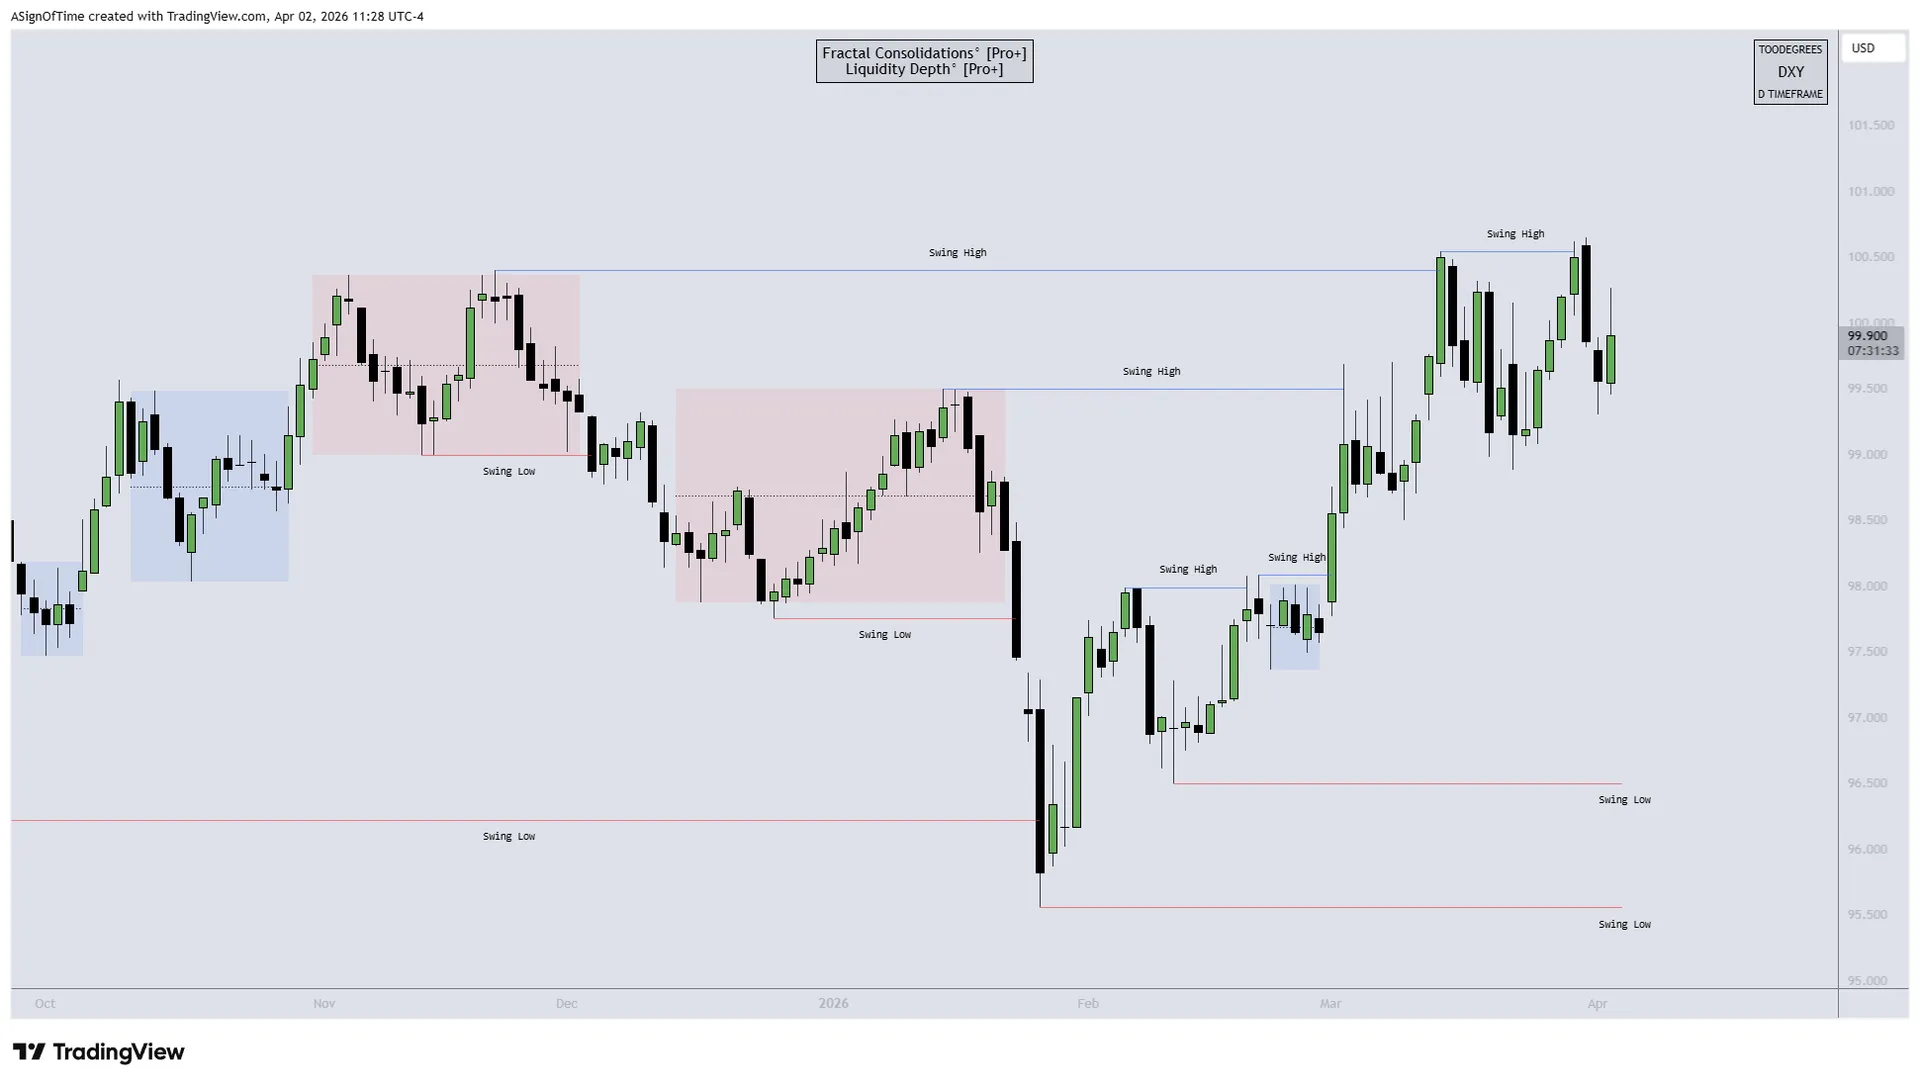
The current DXY structure reflects a completed Market Maker Buy Model. The framework began with the original consolidation formed in November 2025, which was followed by a distribution phase lower into January.
At the end of January 2026, price delivered a Smart Money Reversal, marking the low of the cycle and shifting the broader structure. From there, February and March developed the re-accumulation phases, with price building the buyside of the curve through a series of higher lows and reclaimed swing highs.
The model reached completion in the second week of March, when DXY expanded into the key upside objective and fulfilled the bullish delivery sequence. This confirmed that the re-accumulation process had transitioned into a completed expansion leg.
With the Market Maker Buy Model now completed, focus shifts away from early-stage continuation and toward whether DXY consolidates near the highs or begins a corrective retracement after completing the bullish framework.
Section 6
Technical Analysis With Stat Map: US Dollar Index Daily Chart
US Dollar Index: Statistical Mapping
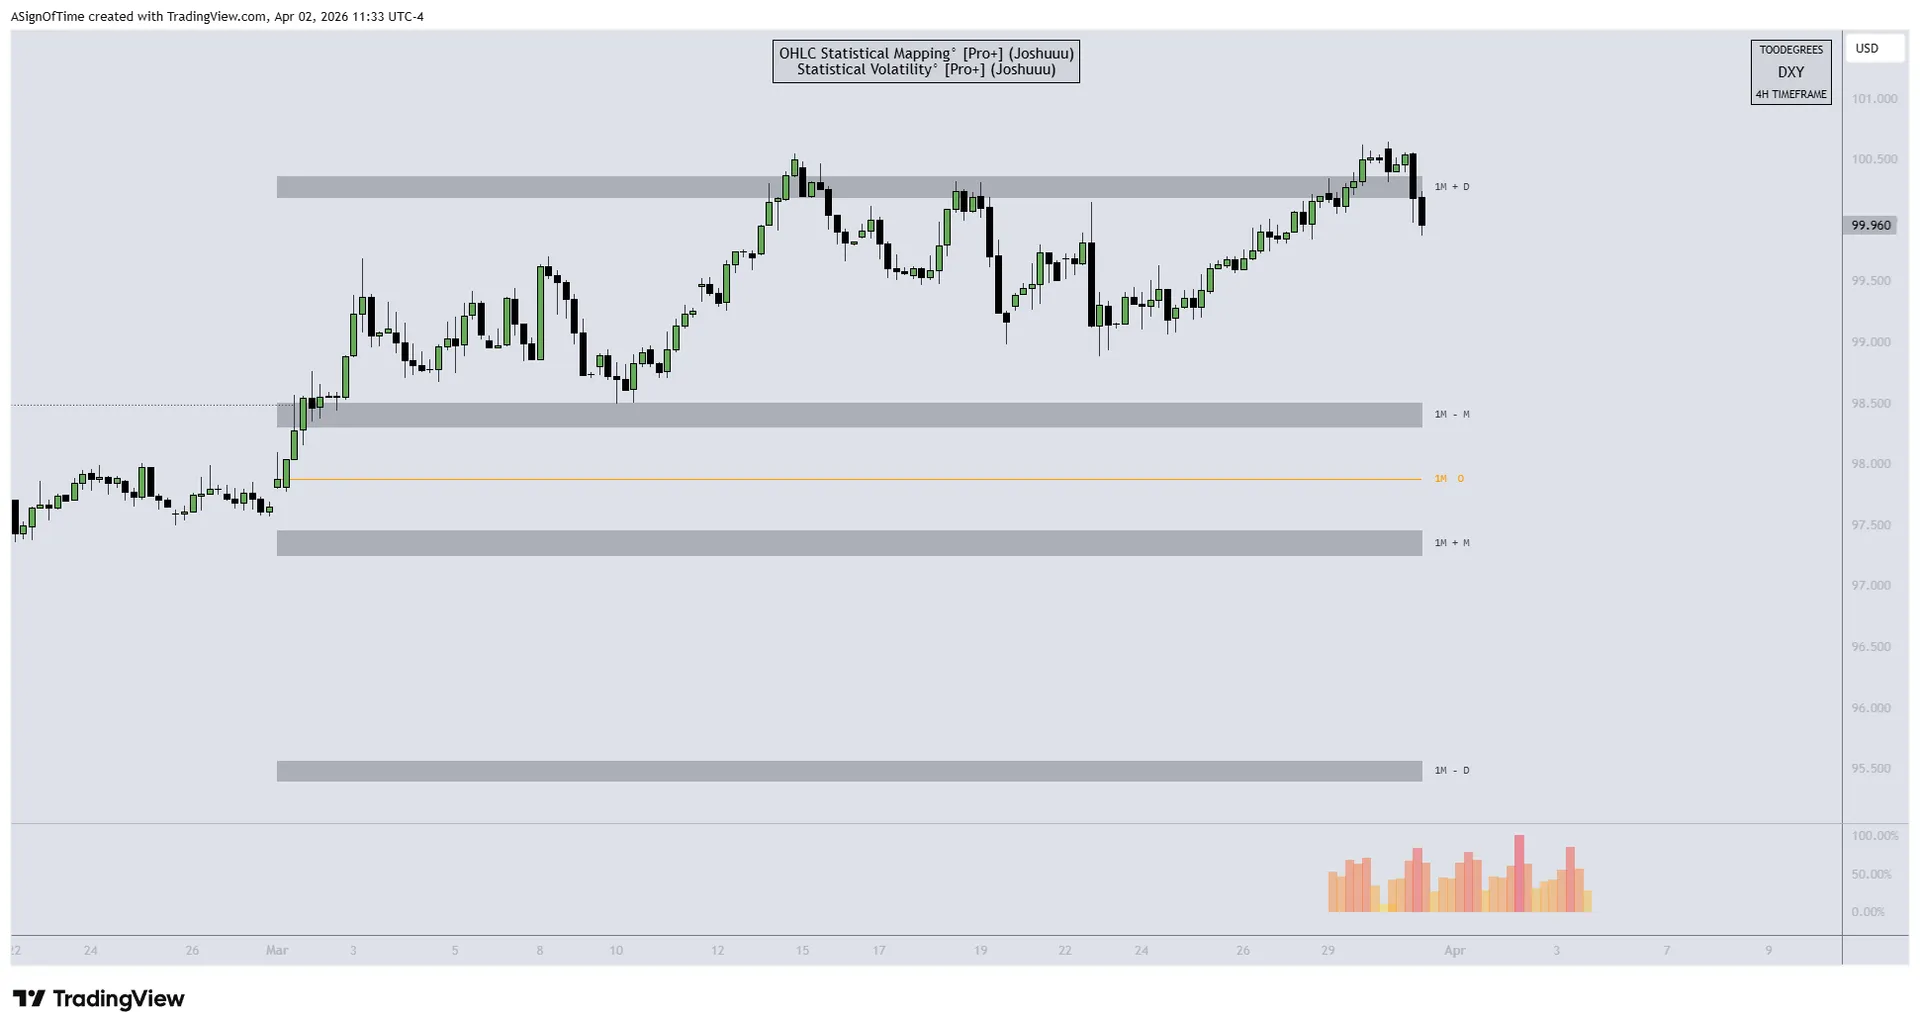
On the 1-Month Stat Map (Median + Mean), DXY remained contained between the bullish and bearish manipulation zones throughout March.
March opened with immediate upside expansion, as price moved higher from the monthly open and advanced directly into the bullish distribution level. This confirmed strong directional intent early in the month.
Once price reached that upper statistical boundary, momentum began to slow. DXY remained supported near the highs, but it did not show sustained acceptance above the bullish distribution level, suggesting that upside delivery was being capped at that objective.
Toward the end of March, price tested the bullish distribution level again, but once more failed to expand beyond it. Overall, March reflects strong upside expansion into a defined statistical target, with price reaching distribution but not yet establishing continuation above it.
Section 7
Inter-Market Dynamics
A quick overview of all three asset classes, NQ, DXY, and T-Bonds, tracking orderflow, seasonality, open interest, market condition, COT positioning, and interest rate context as of March 2026.
| Metric | NQ | DXY | T-Bonds |
|---|---|---|---|
| Orderflow | Bearish → Bearish | Bullish → Bullish | Bullish → Bearish |
| Seasonality | Bearish → Bullish | Sideways → Bearish | Sideways → Bearish |
| Open Interest | Declining | Rising | Flat |
| Market Condition | Expanding Lower | Expanding Higher | Expanding Lower |
| COT Report | Net Short | Net Short | Net Short |
| Interest Rate | — | 3.75% to 4.00% | — |
Analyst Insight
March's inter-market picture shows a clear divergence: NQ expanding lower while DXY expands higher, the classic inverse relationship playing out. T-Bond OI going flat after declining suggests bond markets are pausing rather than aggressively repositioning. The uniform Net Short COT across all three reflects broad risk-off institutional positioning entering April.
Section 8
Conclusion: Analysis Recap
March reflected a transition from corrective stabilization into more directional repricing, particularly across FX and rates. Market behavior shifted away from February's rotational structure, with clearer trends emerging as macro expectations and capital flows realigned.
U.S. equities remained under pressure, with price continuing to respect higher-timeframe structures while failing to sustain upside expansion. The environment remained sensitive to external catalysts, with geopolitical developments increasingly capable of driving sharp directional shifts and disrupting technical positioning.
In FX, the U.S. Dollar strengthened meaningfully, reclaiming higher levels following its late-January reversal. The move was supported by improving relative strength and rate differentials, while EUR and GBP extended lower within corrective structures, reinforcing USD dominance.
Rates markets saw continued repricing, with the yield curve steepening as longer-dated yields moved higher. This reflects evolving expectations around growth, inflation persistence, and the likelihood of a prolonged higher-rate environment.
Overall, March reinforces a market environment transitioning out of consolidation into selective expansion. Going forward, attention remains on macro catalysts, liquidity conditions, and geopolitical developments, which are increasingly influential in shaping short-term direction and volatility.
Featured Indicator