Do Indicators Repaint? What Traders Need to Know
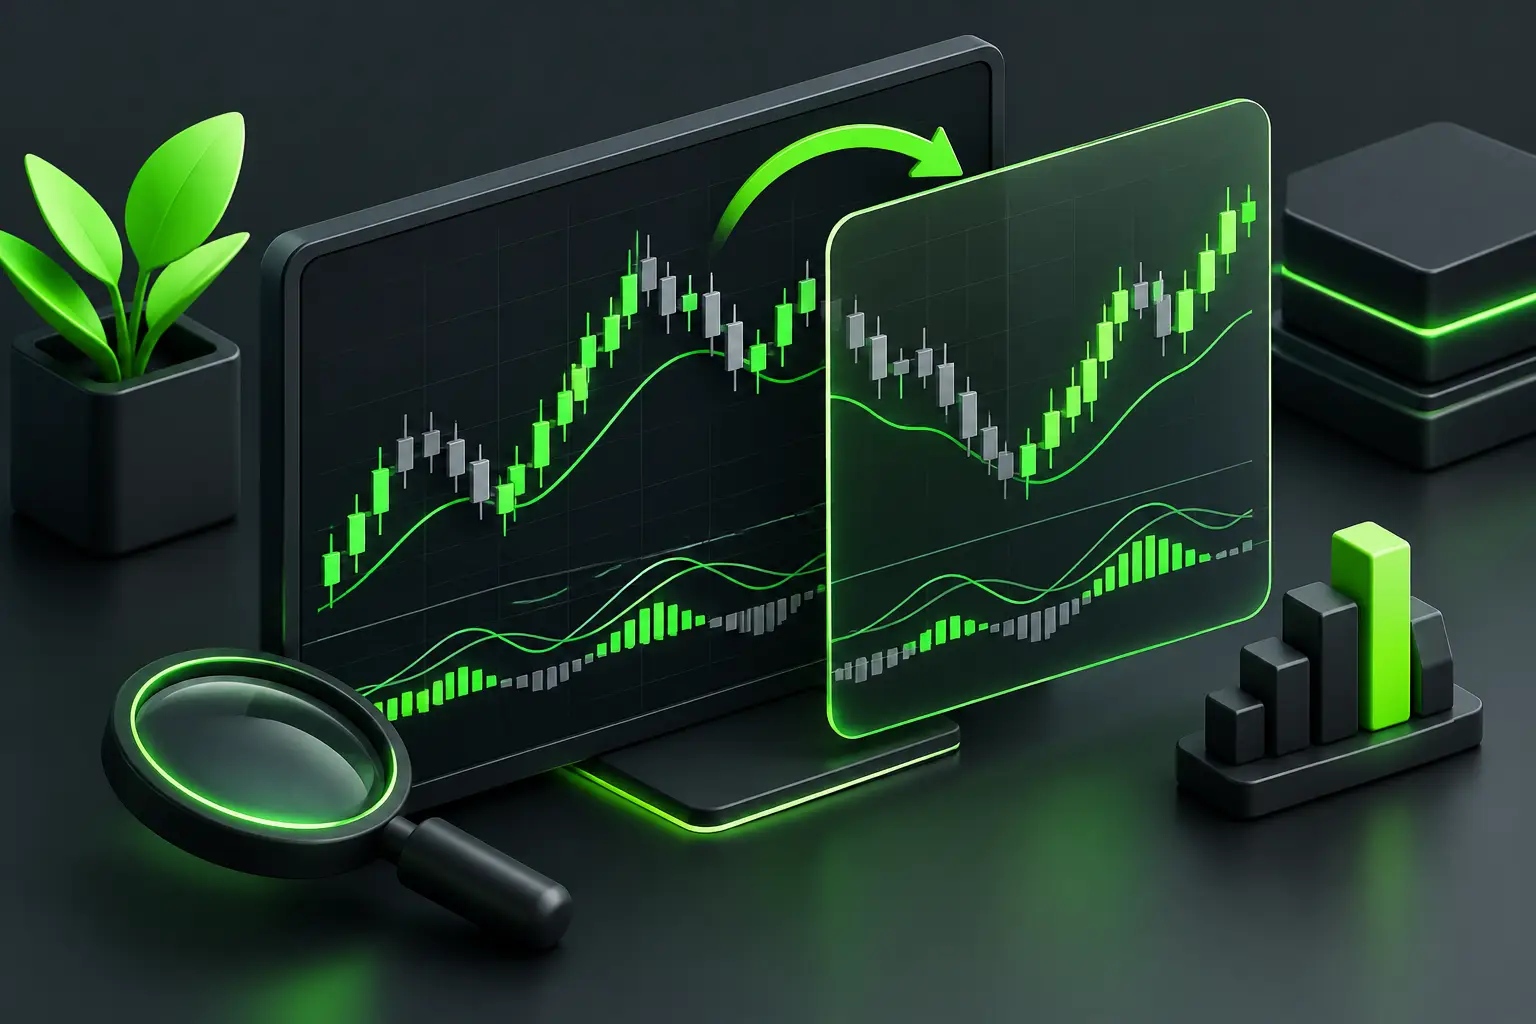
A clean historical chart can make almost any model look obvious. The real test is what happens when price is trading through the level in real time. So, do indicators repaint? Some do. Some only update while a candle is open. Others use confirmed data but can still appear to move because of higher-timeframe calculations, pivots, or visual plotting choices.
For ICT and SMC traders, that distinction matters. If an indicator marks liquidity, structure, FVGs, SMT, or a reversal model differently after the fact, you need to know whether that is expected confirmation logic or a problem that changes the trade premise. A tool should reduce chart work, not create uncertainty about what you could have known at the time.
What repainting actually means
Repainting is often used as a catch-all term, but it describes several different behaviors. Treating them as the same thing leads to bad tool evaluations.
The most serious form is future-data repainting. This occurs when a script uses information that was not available at the time of the signal, then plots a historical result as if it were actionable live. A signal appears on a closed bar after later price action confirms it. On replay, it looks precise. In live conditions, it was never there when the decision had to be made.
A second behavior is intrabar updating. On an open five-minute candle, the high, low, close, displacement, and fair value gap conditions can change tick by tick. An indicator may print a setup during the candle, remove it before close, and then print a different result once the candle closes. That is not necessarily deceptive. It is simply reflecting an unfinished auction.
Then there is confirmation-based plotting. A swing high needs bars to its right before it can be confirmed as a pivot. A fractal model cannot know that the current high will remain the high until subsequent candles fail to take it. The plotted pivot may appear several bars back, but the confirmation only happened later. This is valid logic when the tool makes the confirmation timing clear.
Finally, higher-timeframe data can shift until its source candle closes. An hourly PD array, daily open, or four-hour range calculated on a lower timeframe can evolve while that higher-timeframe candle is still active. Traders sometimes call this repainting, but it is more accurately an unconfirmed HTF value.
Do indicators repaint on TradingView?
TradingView indicators can repaint, but TradingView itself is not the issue. Repainting comes from the script logic, the timeframe relationship, and whether the user understands confirmed versus developing data.
Every live candle is fluid. A one-minute market structure shift based on a candle close should not be considered final while that one-minute candle is still trading. The same applies to a CISD condition, an imbalance threshold, or a close back through equilibrium. If your execution model requires a close, wait for a close.
Higher-timeframe requests require even more attention. A five-minute chart displaying the current one-hour candle is seeing incomplete one-hour information for most of that hour. The high and low can expand. The close changes continuously. Any bias or level built from that developing candle can update until the hourly close locks the data.
This is not a reason to avoid multi-timeframe automation. It is a reason to identify which plotted elements are confirmed and which are live. Developing levels can be useful for context and anticipation. Confirmed levels are stronger for rules-based execution, journaling, and performance review.
Legitimate confirmation versus misleading signals
A pivot is the simplest example of a legitimate delayed signal. Suppose a swing-high setting requires two candles on each side. The high is not confirmed until two later candles close without exceeding it. The tool may draw the swing marker above the original candle, but a properly designed indicator will make clear that the confirmation occurred two bars later.
That delay is a trade-off. You gain objective structure and lose the ability to act at the exact extreme. For many traders, that is acceptable because the purpose is not to predict every turning point. It is to organize confirmed liquidity, establish dealing range context, and avoid treating every local high or low as meaningful structure.
Misleading behavior is different. If a historical entry arrow appears at the exact reversal candle, but the setup only becomes visible after price has already moved away, the chart is overstating what was actionable. The same problem exists when scripts use lookahead behavior with higher-timeframe data, allowing lower-timeframe bars to display the completed HTF candle before it actually closed.
Visual offsets also deserve scrutiny. Plotting a confirmation marker back on the originating bar can make a chart easier to read. But it should not be confused with the signal timestamp. Strong charting tools preserve that distinction through settings, labels, alerts, documentation, or clear behavior in bar replay.
How to test whether an indicator repaints
Do not judge an indicator from screenshots alone. Screenshots are useful for seeing chart clarity, but they cannot show what happened candle by candle. Run the tool through the conditions where repainting claims usually appear: session opens, fast displacement, major HTF closes, and range expansion.
Use this workflow before building a model around any indicator:
- Watch it on a live or simulated chart and note what prints during an open candle versus after the candle closes.
- Use Bar Replay one candle at a time. Record when a level, alert, or setup first becomes visible, not just where it ends up on the chart.
- Test across the timeframes you actually trade. A five-minute execution tool can behave differently when it references a one-hour or daily condition.
- Compare alert timing with plotted timing. An alert that triggers only after confirmation may be correct even if the visual marker is drawn on an earlier bar.
- Review volatile sessions as well as clean trending examples. Fast markets reveal whether a tool handles developing conditions honestly.
Keep a simple note of the result. For example: “Five-minute FVG displays after candle close,” or “Hourly range updates until the top of the hour.” That turns vague concerns about repainting into operating rules for your playbook.
Repainting and ICT/SMC chart workflows
Not every tool in an ICT/SMC workflow needs the same confirmation standard. Session opens, prior-day highs and lows, and completed fair value gaps are generally fixed once their source data is complete. Developing daily range projections, current-session statistics, and active correlation readings are supposed to update as the market develops.
The key is matching the tool to the decision. If you use SMT as contextual confluence, a live divergence can be valuable before it fully confirms. If you use it as the sole trigger for a futures entry, waiting for the paired closes may be more appropriate. Neither choice is universally correct. It depends on your risk tolerance, holding period, and the rest of your entry model.
The same applies to structure. A developing break can help an aggressive trader prepare for a retracement into an IFVG. A conservative trader may require a closed candle, displacement, and a confirmed shift before acting. Automation should support those differences with configurable logic rather than pretending one interpretation fits every execution style.
This is where specialized TradingView tools earn their place. A properly built indicator can keep HTF context, liquidity references, session data, and model conditions visible without forcing you to redraw the same analysis before every open. Toodegrees focuses on that workflow: your framework remains discretionary, while repetitive chart preparation becomes faster and more consistent.
What to ask before trusting a signal
Ask four direct questions. Was this condition visible at the time? Does it require a candle close? Does it depend on an unfinished higher-timeframe candle? And does the plotted location match the moment I could have acted?
If you cannot answer those questions, do not use the signal as proof that a model works. Treat it as visual context until you have tested the live behavior yourself. This standard protects you from both bad scripts and unrealistic expectations about good ones.
The best indicator does not need perfect hindsight. It needs to show you the right information, at the right time, with enough clarity for you to execute your rules. Build around signals you can observe, verify, and repeat when the chart is moving.

Want These Concepts Automated?
Stop spending hours marking up charts. Our suite of 15 premium indicators automates the analysis discussed in these articles.