IFVG Indicator TradingView for Reclaim Setups
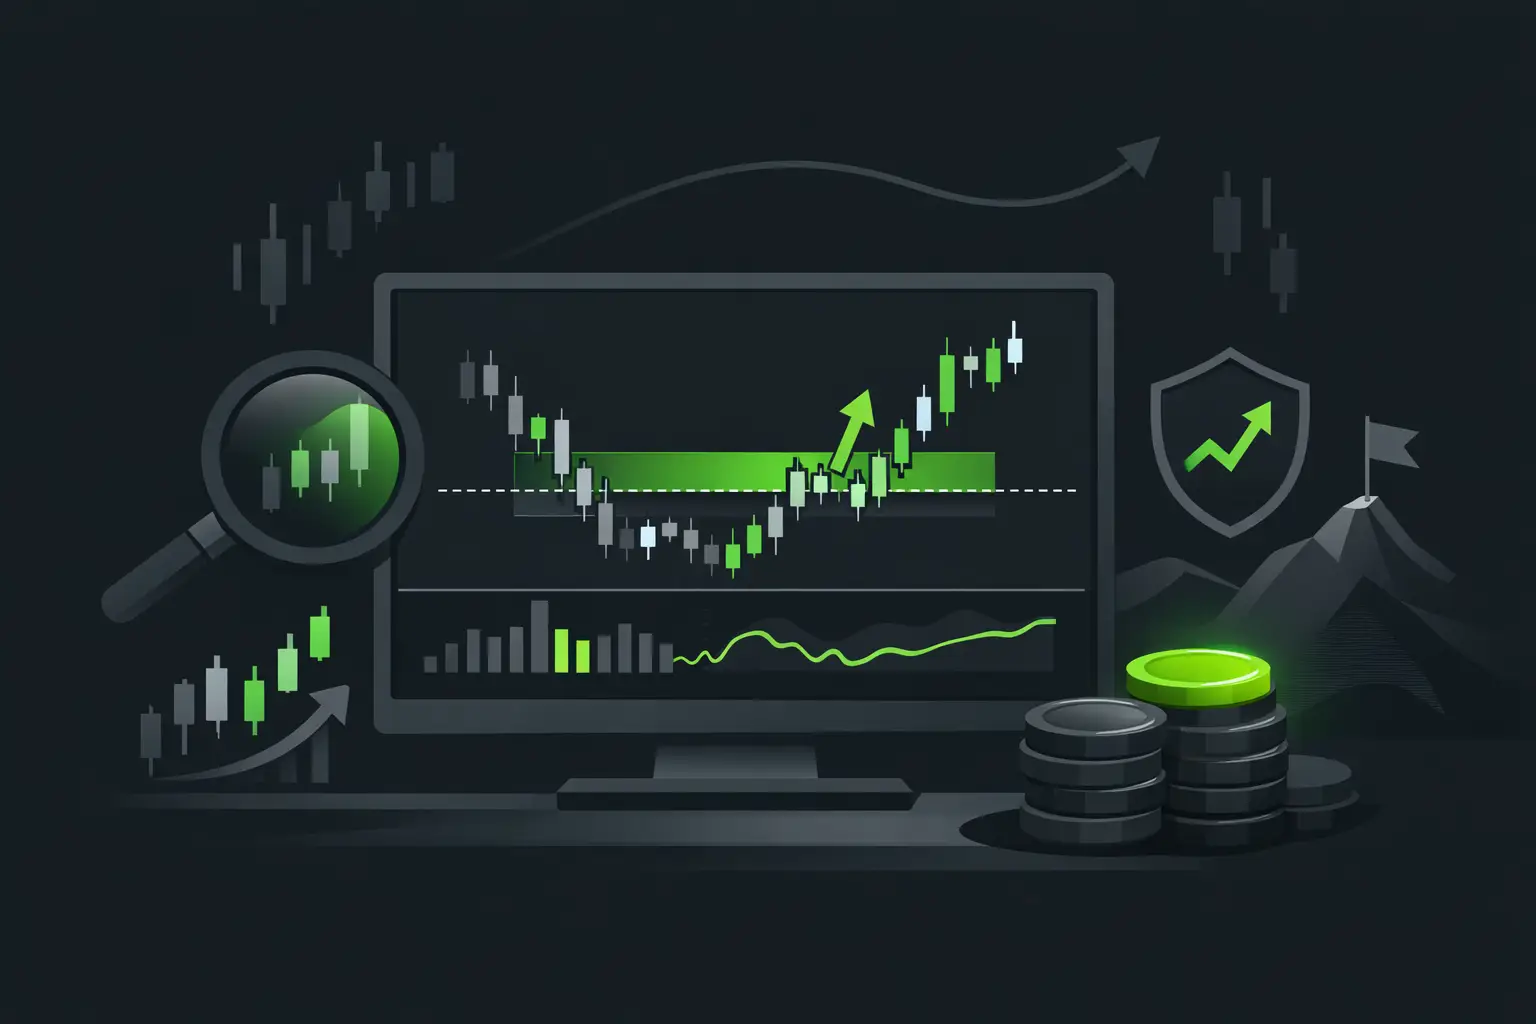
A fair value gap is easy to see after price has reacted from it. The work is identifying when that same imbalance has failed, flipped, and become actionable before the next move develops. An ifvg indicator tradingview workflow is built for that job: it keeps inversion fair value gaps visible while you assess displacement, structure, liquidity, and timing.
For ICT and SMC traders, an IFVG is not a standalone entry signal. It is a change in the behavior of an existing imbalance. Price trades through a fair value gap with intent, closes beyond it, then returns to test the area from the other side. That prior discount or premium delivery zone can become resistance or support. The value of an indicator is not that it replaces the read. It removes the repeated task of finding, extending, and managing those zones across charts and timeframes.
What an IFVG indicator on TradingView tracks
An inversion fair value gap begins as a standard three-candle imbalance. In a bullish fair value gap, the low of the third candle remains above the high of the first candle, leaving an inefficiently traded range between them. A bearish gap is the inverse. Traders commonly use these areas as potential retracement zones when they align with directional context.
The inversion occurs when price decisively trades through that original gap. The key word is decisively. A wick into the zone is not automatically an inversion. Many traders require a candle close through the far side of the gap, often with displacement, before treating it as failed. Once confirmed, the former bullish FVG can act as resistance on a retest. A former bearish FVG can act as support.
A capable TradingView overlay should separate the stages clearly: newly formed FVGs, mitigated or filled gaps, and confirmed IFVGs. It should also extend valid zones forward, preserve the relevant boundaries, and prevent the chart from becoming a stack of expired rectangles. That visual hierarchy matters when ES, NQ, or YM is moving quickly through a session open.
Why the reclaim matters more than the rectangle
The rectangle is only the location. The trade thesis comes from the delivery that created the inversion and the reaction that follows it.
Consider a bearish intraday sequence in NQ. Price raids buy-side liquidity above a morning high, displaces lower through a prior bullish fair value gap, and closes below the gap. The original bullish imbalance is now a potential bearish IFVG. If price retraces into that zone during a lower-timeframe pullback, rejects it, and resumes lower, the IFVG provides a defined area to evaluate risk against the surrounding structure.
That sequence carries more weight than an isolated inverted gap in the middle of a range. The best cases tend to have confluence: a liquidity sweep or draw on liquidity, clear displacement, a meaningful market-structure shift or CISD, and room toward a logical target. An IFVG can refine an entry. It cannot manufacture a directional narrative where none exists.
This is also why a reclaim is often preferable to chasing the displacement candle. The retest lets price prove whether the flipped zone is being defended. Sometimes it will not return, and the move will leave without you. That is the trade-off. Waiting for confirmation can improve location and risk definition, but it will reduce participation in one-way expansions.
Build the IFVG workflow from higher to lower timeframe
The cleanest use of an IFVG indicator on TradingView starts before the execution chart. Mark the higher-timeframe dealing range, current premium or discount, external liquidity, and likely draw. Then use the lower timeframe to determine whether price is delivering in line with that context.
A practical workflow looks like this in real time:
- Start with the daily, 4-hour, or 1-hour chart. Determine whether price is seeking a prior high, prior low, session gap, imbalance, or opposing liquidity pool.
- On the execution timeframe, watch for the liquidity event and displacement. A five-minute IFVG has a different role when it forms after a sweep at a 1-hour premium than when it forms inside random midday consolidation.
- Require your confirmation condition. That may be a close through the original FVG, a CISD, a break in local structure, or a combination of all three.
- Let price revisit the confirmed IFVG only if the return fits your model. Evaluate reaction quality, not simply whether the zone was touched.
- Define invalidation beyond the relevant swing, the far edge of the zone, or the event that invalidates the larger thesis. Targets should be based on available liquidity and opposing PD arrays, not an arbitrary fixed multiple.
The point is not to force every phase into a mechanical checklist. It is to keep the same order of operations every day. Higher-timeframe context tells you where an IFVG matters. Lower-timeframe behavior tells you whether it is being respected.
Choose settings that match your execution timeframe
More gaps on screen do not create more opportunity. On a one-minute chart, permissive gap detection can produce so many boxes that meaningful locations disappear. Filtering by minimum gap size, displacement, session, or timeframe can improve clarity. The correct threshold depends on the instrument's volatility and your holding period.
For a scalp-oriented futures trader, a one- or five-minute IFVG may be the execution zone while 15-minute and 1-hour structure control bias. For a trader holding through a larger intraday move, five-minute and 15-minute inversions may be more useful than every micro gap produced on the one-minute chart. Test the display during replay or review, but judge settings on live-session readability, not on how perfect they look after the fact.
It also helps to decide how long zones remain relevant. An untested IFVG from the London session may still matter into New York if it aligns with the day's delivery. A small inversion created in the middle of a low-volume lunch range may not deserve to remain on the chart into the close. Expiration rules reduce noise, but overly aggressive rules can remove the exact level price later respects.
Avoid the common IFVG mistakes
The first mistake is calling every filled FVG an inversion. Mitigation and inversion are different events. Price can trade into a bullish FVG, react higher, and preserve its bullish role. An IFVG requires acceptance through the area and evidence that order flow has changed.
The second is treating the first touch as guaranteed. IFVGs are zones, not limit-order promises. Price can trade through the full zone, rebalance deeper into a larger imbalance, or invalidate the setup entirely. Entries still need a risk framework. Traders who use a lower-timeframe confirmation may sacrifice some precision for stronger evidence of defense.
The third is ignoring session context. A textbook-looking IFVG during the New York open, after a liquidity raid and strong displacement, has a different profile from one printed during thin overnight trade. Time of day does not invalidate the setup, but it changes expected range, follow-through, and the quality of displacement.
The fourth is confusing automation with decision-making. An indicator can identify and maintain the zone consistently. It cannot know whether you should trade after high-impact data, whether the broader market is balanced, or whether your daily loss limit has been reached. The trader remains responsible for context, size, and execution.
Use automation to keep chart prep honest
Manual marking has a hidden cost: it encourages inconsistency. One day you extend an FVG until it is fully filled. Another day you delete it after a partial touch. One chart gets every lower-timeframe gap; another gets only the ones you happened to notice. That makes review harder because the process itself changed.
A purpose-built IFVG overlay gives the chart stable rules. You can preserve active zones, distinguish inversions from untouched gaps, control colors and labels, and align the display with your model. At Toodegrees, the objective is simple: automate the repetitive chart work so traders can spend more attention on bias, confluence, and execution.
Keep the final decision deliberately discretionary. If an IFVG aligns with higher-timeframe draw, session timing, liquidity, and a clean lower-timeframe shift, it may be the precise return area your model needs. If it is just another box in the middle of a range, let it remain what it is: information, not an obligation to trade.


Want These Concepts Automated?
Stop spending hours marking up charts. Our suite of 15 premium indicators automates the analysis discussed in these articles.