Is There an Indicator for ICT Power of Three on Higher Timeframes?
Written by
A Sign Of Time
Head of Education & Toodegrees Analyst
Key Summary
- Power of Three is ICT's model for how a candle forms: accumulation, manipulation, then distribution.
- Reading it on a higher timeframe normally means switching layouts to watch a candle you are not trading.
- HTF Power of Three° [Pro+] plots a chosen higher-timeframe candle's live development directly on your lower-timeframe chart, so no layout switching is needed.
- The tool ships in the Premium Suite, and is also included in the Elite Collection. It is not an Elite-exclusive tool.
What Is ICT's Power of Three?
Power of Three, or PO3, is a trading concept developed by ICT that describes three phases in the formation of a single candle: accumulation, manipulation, and distribution. In a bullish scenario, accumulation happens when the market engineers liquidity at or below the opening price, where smart money builds long positions. Manipulation follows: price may dip below the opening price, triggering stop losses and gathering the liquidity needed. Distribution closes the sequence, as price moves higher and closes above the opening price. A bearish candle mirrors this in the opposite direction.
Traders apply PO3 to any candle on any timeframe. A 1-minute candle, a daily candle, and a weekly candle all form through the same three phases. The question is which timeframe's PO3 actually matters for the trade being taken.
Why Trade Power of Three on a Higher Timeframe?
A higher-timeframe (HTF) candle gives the phase context; a lower-timeframe (LTF) chart gives the entry. A trader working an intraday 1-minute chart, while the accumulation-manipulation-distribution sequence that matters is unfolding on the daily candle, needs to see both at once. The conventional way to do that is keeping a second chart open on the higher timeframe and mentally tracking where that candle sits in its cycle, a manual process that means switching layouts or splitting the screen every time HTF context needs a check.
This is the situation behind the question: is there an indicator for ICT Power of Three on higher timeframes, so the HTF candle's phase stays visible without leaving the chart being traded.
Is There an Indicator for HTF Power of Three? Yes.
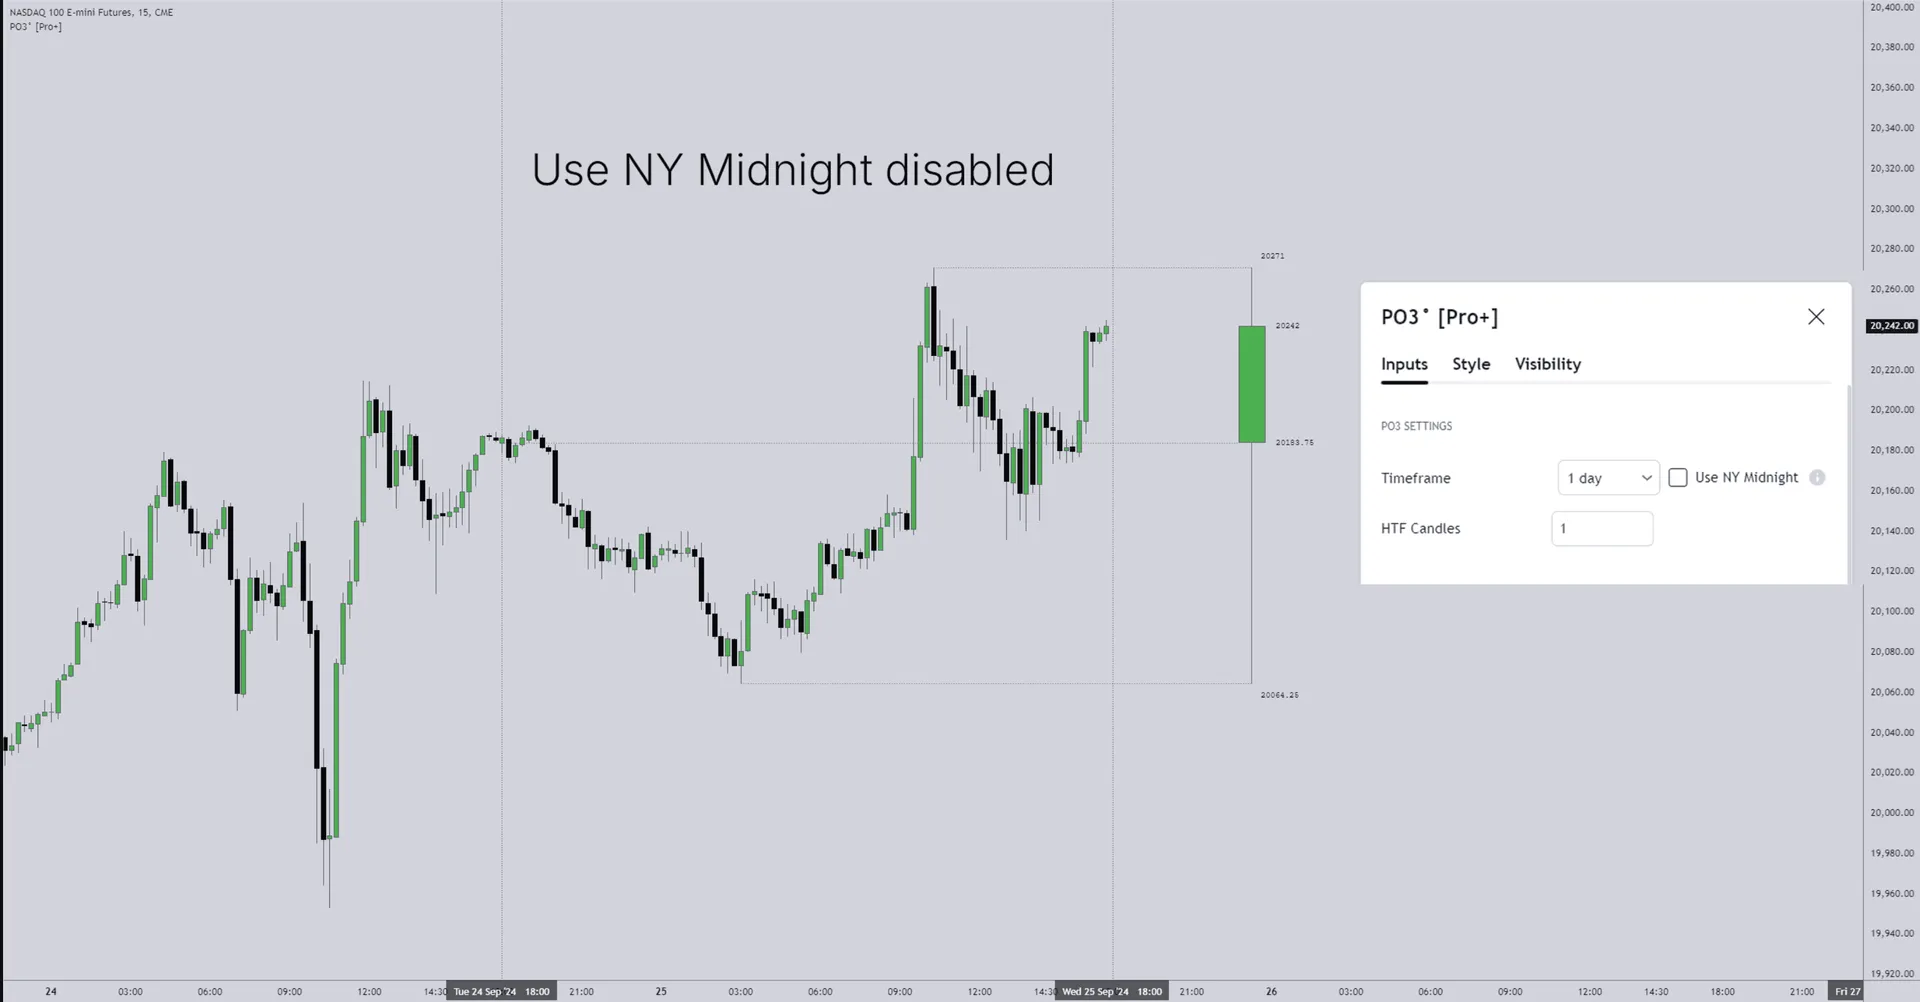
HTF Power of Three° [Pro+] plots a selected higher-timeframe candle's live development directly onto the lower-timeframe chart. Verified capabilities include: selecting any higher timeframe and monitoring its candle developing live, with unlimited HTF candles plotted at once; an optional New York midnight open for Weekly and Daily candles; spotting HTF PD Arrays (price delivery arrays) while keeping the LTF view active; plotting the current HTF candle's Open, High and Low directly on the LTF chart, with a countdown timer to its close.
It also displays as candles or bars, allows hovering over past HTF candles for their OHLC and range, and can stack multiple HTF instances to track several higher timeframes on one chart. It backtests across two or more timeframes at once, including in Replay Mode, and carries the Monsterlab PO3 Dealing Range (high, low, equilibrium and quarters) plus TTrades Weekly Profiling.
HTF Power of Three° [Pro+] ships in the Premium Suite, the in-house Pro+ toolkit, and is also included in the Elite Collection. It is not an Elite-exclusive tool.
How to Read the HTF Candle on Your LTF Chart
Once added, the indicator projects the HTF candle's open line, high/low lines, and OHLC values as text directly on the active chart. Positioning below the open in a bullish scenario, or above it in a bearish one, follows the same accumulation logic ICT teaches for the midnight open. The countdown timer shows how much of the HTF candle remains, and hovering over previous HTF candles surfaces their OHLC and range for context.
Turning on Show Intra Candles breaks the HTF candle into the lower-timeframe candles that compose it, so the accumulation-manipulation-distribution phases can be watched building in real time rather than only seen as a finished HTF candle after the fact.
Key Questions
Yes. HTF Power of Three° [Pro+] plots a chosen higher-timeframe candle's live development directly on the lower-timeframe chart, so accumulation, manipulation and distribution stay visible without switching layouts.
Accumulation, manipulation, and distribution. In a bullish candle, accumulation builds positions near the open, manipulation triggers stops with a dip below the open, and distribution closes the candle higher. A bearish candle mirrors the sequence.
HTF Power of Three° [Pro+] is included in the Premium Suite, the in-house Pro+ toolkit. It is also included in the Elite Collection, which bundles every Toodegrees tool, but it is not an Elite-exclusive tool.
Framework: The Three PO3 Phases on a Higher Timeframe
| Phase | What Happens (Bullish Scenario) | What HTF Power of Three° Plots |
|---|---|---|
| Accumulation | Price engineers liquidity at or below the open while positions build | The HTF open line, plotted live on the LTF chart |
| Manipulation | Price dips below the open to trigger stops and gather liquidity | The HTF low line and Intra-Bar detail, if enabled |
| Distribution | Price closes back above the open | The HTF close, visible once the candle completes, plus the countdown timer through the process |
Power of Three is a timeframe-alignment concept: the phase that matters is often forming on a timeframe not currently in view. HTF Power of Three° [Pro+] closes that gap by projecting the higher-timeframe candle's structure onto the chart actually being traded, rather than asking a trader to hold two layouts in their head.
Track HTF Power of Three on your own charts
Add HTF Power of Three° [Pro+] to a TradingView chart and watch the higher-timeframe candle develop live, on the chart you already trade.
Frequently Asked Questions
No. The developing HTF candle updates live as price forms it, which is the point, but the plotted phases and the HTF open, high and low do not redraw historically once set.
No. The developing HTF candle is plotted directly onto the execution chart, and multiple instances can be stacked to show several higher timeframes at once.
Yes, all Toodegrees indicators are built exclusively for TradingView. They work on all TradingView plans including the free tier.
Continue Reading
Ready to Automate Your Analysis?
Join 30,000+ traders using Toodegrees indicators to save time and find higher-probability setups.