Fair Value Gap TradingView Indicator Setup
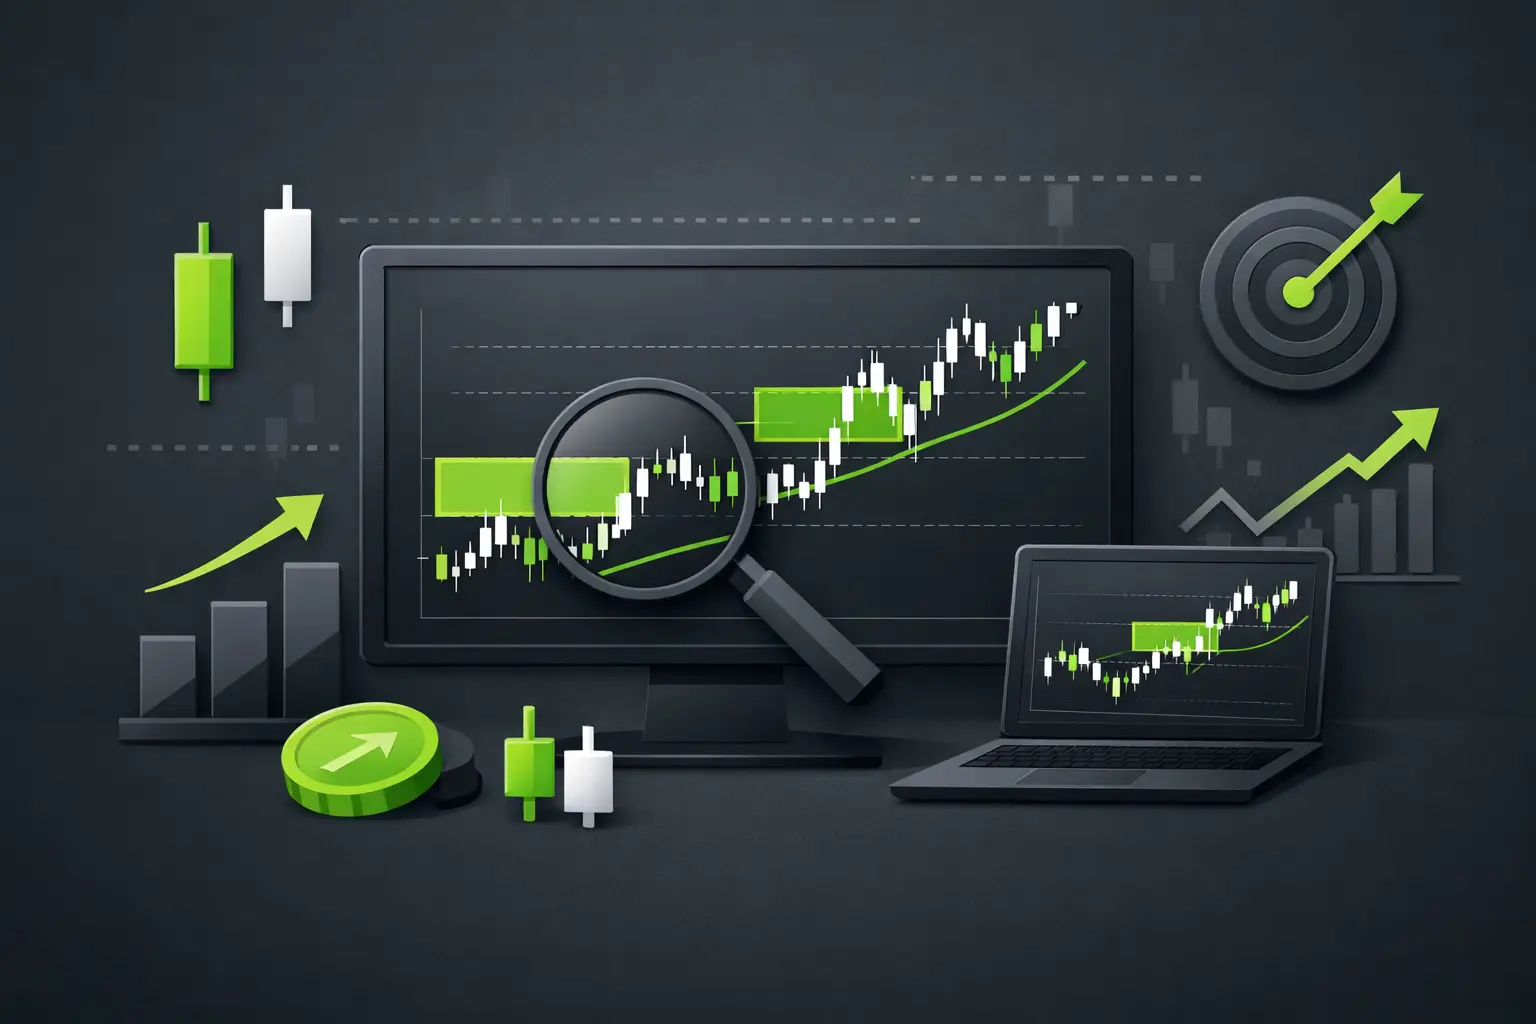
A fair value gap TradingView indicator should reduce chart work, not add another layer of colored boxes to manage. For ICT and SMC traders, the value is not simply seeing every three-candle imbalance. It is knowing which gaps matter at the current location, which timeframe is driving delivery, and whether price is likely to respect, fill, or invert the area.
The difference between a useful FVG workflow and chart clutter is context. A gap created during real displacement after a liquidity sweep carries a different message than one printed in the middle of balanced overnight trade. Your indicator needs to help you separate those conditions quickly so your attention stays on execution.
What a Fair Value Gap Actually Measures
A fair value gap is a three-candle price inefficiency. In a bullish FVG, the low of the third candle remains above the high of the first candle. In a bearish FVG, the high of the third candle remains below the low of the first candle. The middle candle is the displacement candle that moved price aggressively enough to leave an untraded range behind.
That mechanical definition is useful, but it is not a trade signal by itself. Price can return to a gap, partially rebalance it, trade through it, or ignore it for an extended period. A fair value gap becomes actionable when it aligns with the market narrative: liquidity has been taken, structure has shifted, higher-timeframe price is positioned correctly, and the gap provides a logical location for entry or target delivery.
Think of the FVG as evidence of urgency. It shows where one side of the auction temporarily overwhelmed the other. The question is whether that urgency belongs to the move you want to trade or to the move you should avoid chasing.
Why Use a Fair Value Gap TradingView Indicator
Manual marking works when you are reviewing one chart after the close. It becomes inefficient when you are preparing ES, NQ, YM, and correlated markets across several timeframes before New York open. Every fresh candle can create another imbalance. Every timeframe can tell a slightly different story.
A fair value gap TradingView indicator automates the repetitive layer: detecting valid gaps, extending them until mitigation, showing midpoint equilibrium, and filtering visual noise. This matters because the manual task is rarely the edge. The edge is the interpretation of location, displacement, liquidity, and confirmation.
The right configuration also protects you from a common mistake: treating every intraday FVG as equal. A one-minute gap inside a five-minute consolidation is not comparable to a 15-minute gap created after price raids a session high and displaces lower through structure. Automation should make that distinction easier to see, not force you into a single rule set.
Build the Indicator Around Your Trading Model
Start by deciding what role FVGs play in your framework. Some traders use higher-timeframe gaps as draw-on-liquidity targets. Others use lower-timeframe gaps for retracement entries after a market structure shift or CISD. Many use both, but with different expectations.
For directional context, keep higher-timeframe gaps visible from the 1-hour, 4-hour, or daily chart. These zones can frame premium and discount, identify likely rebalance areas, and clarify whether intraday price is delivering toward unfinished business. If price is opening beneath a meaningful bearish 4-hour FVG, a long setup needs stronger evidence than it would in open space.
For execution, focus on the timeframe that matches your holding period. A scalper may use one-minute and five-minute FVGs after a sweep of intraday liquidity. A trader holding through the morning may prioritize five-minute and 15-minute gaps. There is no universally correct chart interval. It depends on the instrument’s volatility, your stop size, and how much noise you can tolerate.
Your settings should reflect that division. Limit lower-timeframe gap display by size or relevance, retain higher-timeframe zones longer, and show a midpoint only if you actually use consequent encroachment in your execution plan. If midpoint reactions are not part of your model, displaying them can become visual friction rather than useful data.
Filters Matter More Than More Boxes
Most FVG indicators can identify gaps. The practical difference comes from filtering. Consider the filters that match the way you trade: minimum gap size, timeframe selection, extension behavior, fill logic, and session relevance.
A minimum-size filter is especially useful in index futures. During quiet periods, small gaps can appear constantly and create the impression of opportunity where there is only rotation. During New York cash open, a larger imbalance created with displacement may deserve attention even if price is moving quickly. The filter should be strict enough to remove noise without hiding the gaps that define your entries.
Fill logic also needs a clear rule. Do you consider an FVG mitigated when price touches the near edge, trades to the midpoint, or fully fills the range? Different traders use different definitions. What matters is consistency. If your chart removes a zone at first touch but your execution model expects a midpoint retracement, the tool is working against your process.
Read FVGs With Liquidity and Structure
The cleanest FVG setup is usually part of a sequence, not an isolated event. Price reaches external liquidity, takes it, displaces away, shifts short-term order flow, then retraces into an imbalance. The gap provides location. The liquidity event and displacement provide the reason.
For example, NQ may run above the London high shortly after the New York open. If that raid is followed by decisive bearish displacement that breaks a meaningful intraday low, a bearish FVG left during the selloff can become a retracement area. The trade idea is not “short because there is a gap.” It is “short because buy-side liquidity was taken, sellers demonstrated control, and the retracement offers defined risk.”
The opposite scenario matters just as much. If price trades into a bullish higher-timeframe FVG while sweeping sell-side liquidity, then prints a lower-timeframe bullish shift, a bullish execution gap may offer a precise long entry. In both cases, the gap is only one component of confluence.
This is also where correlated-market divergence can improve selectivity. If ES takes a high while NQ fails to confirm, or vice versa, SMT may strengthen the case for a reversal. It does not replace confirmation. It helps explain why a liquidity run may be vulnerable when the FVG setup appears.
Use Inversion Fair Value Gaps Carefully
An inversion fair value gap, or IFVG, appears when price trades through an existing FVG and later respects that failed zone from the opposite side. A bullish FVG that fails and becomes resistance can provide a bearish continuation or reversal reference. A bearish FVG that fails and becomes support can do the same for bullish order flow.
IFVGs are useful because they show a failed expectation. But they should not be labeled automatically as a reversal signal. If price closes through a gap during strong higher-timeframe delivery, the inversion may simply support continuation. The key is whether the failure occurs after liquidity is taken and whether structure confirms the new side of the auction.
A Session Workflow That Keeps the Chart Clean
Before the active session, identify the higher-timeframe FVGs nearest current price and mark the external liquidity around them. This gives you a map of likely objectives and reaction zones without forecasting every candle.
As the session develops, let price reveal intent. Watch for raids of Asia, London, premarket, prior-day, or opening-range liquidity. Then look for displacement and a clear lower-timeframe shift. Only after those conditions appear should a newly formed FVG move from chart information to a potential execution zone.
At entry, define the invalidation before you click. In many models, the stop belongs beyond the swing that produced the displacement or beyond the liquidity point that validates the idea. Targets can be opposing liquidity, an unfilled higher-timeframe gap, a session level, or a projected range objective. The exact target depends on time of day and available range, not on a fixed FVG rule.
Toodegrees tools are built around this workflow: preserve your framework, automate the repeated chart marking, and leave the execution decision with the trader. That distinction matters. No indicator can determine whether you are disciplined enough to wait for the setup your plan requires.
The Real Edge Is Selectivity
A chart full of fair value gaps can make every retracement look tradable. That is the trap. The best setups tend to be obvious only after you remove the gaps that formed without meaningful displacement, in the wrong session, or against the higher-timeframe objective.
Use the indicator to see faster, not to trade more often. When a gap aligns with liquidity, structure, session timing, and directional delivery, it can turn a broad idea into a defined execution zone. When those pieces are missing, letting the gap sit untouched is often the most professional decision on the chart.

Want These Concepts Automated?
Stop spending hours marking up charts. Our suite of 15 premium indicators automates the analysis discussed in these articles.