OHLC Statistics Trading Tool for Session Bias
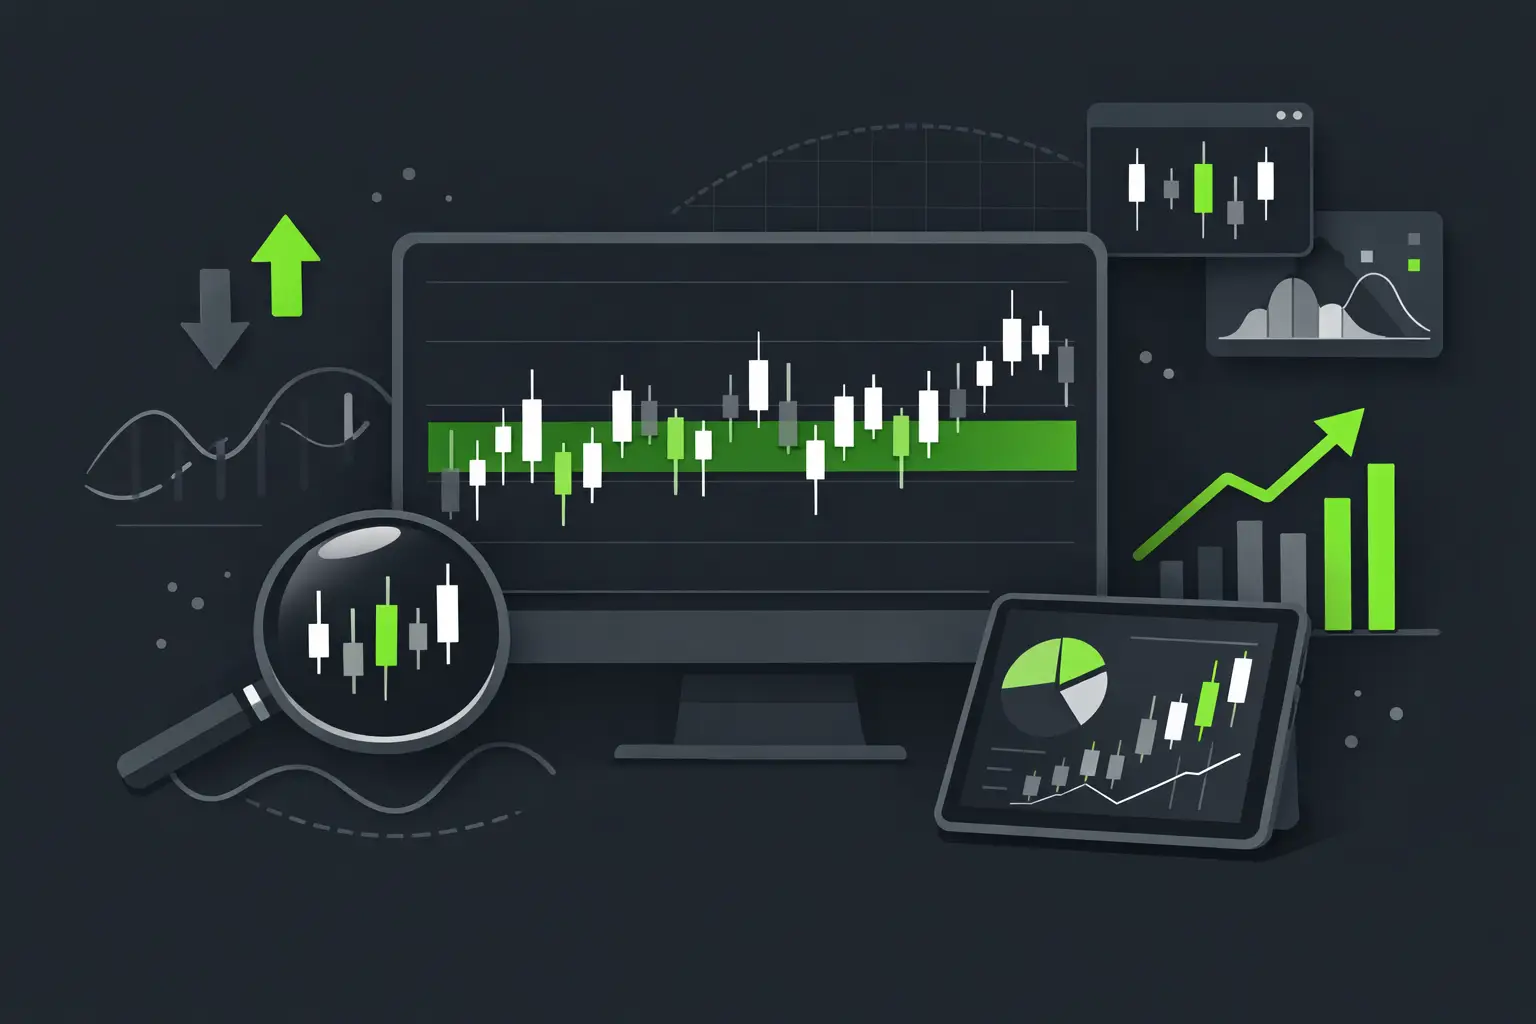
The first five minutes before New York opens should not be spent rebuilding yesterday's range, measuring its close location, and guessing whether price is trading at a meaningful extreme. An ohlc statistics trading tool puts those reference points on the chart before the session develops, so the question becomes execution-focused: where is price relative to the data that matters?
For ICT and SMC traders, OHLC data is not just a candle readout. It is a structured record of where a period opened, where liquidity was reached, whether expansion held, and where price accepted or rejected into the close. Used correctly, it can frame daily bias, expose premium and discount conditions, and give intraday setups context without replacing the need for market structure confirmation.
What an OHLC Statistics Trading Tool Should Show
OHLC stands for open, high, low, and close. The raw values are simple. The edge comes from organizing them across the sessions and timeframes that influence your trade location.
A useful tool does more than print prior-day high and low. It should turn recurring price behavior into chart-ready context: session ranges, opening levels, average movement, close positioning, and the distance between current price and relevant extremes. That matters because an Asia range sweep, a London expansion, and a New York reversal do not carry the same meaning when they occur in different locations within the daily range.
For example, a prior day that closes near its high after reclaiming the open may communicate different order flow than a day that trades above the same high but closes back below its midpoint. Neither outcome is an automatic long or short signal. But each gives you a cleaner framework for deciding whether an intraday displacement, CISD, or fair value gap is aligned with the higher-timeframe delivery.
The best chart display is selective. If every historical open, high, low, average, and label remains visible, the tool creates noise instead of clarity. Active traders need configurable levels that keep the current session actionable while allowing deeper statistics to remain available when needed.
The Levels That Earn Their Space on the Chart
At minimum, prior period OHLC levels establish obvious liquidity references. Prior day high and low are common draw-on-liquidity targets. The prior day open can act as a useful separator between acceptance and rejection, especially after an opening drive. The close provides a reference for overnight positioning and whether the market has returned to a prior area of agreement.
Session-specific statistics add more precision. A trader focused on index futures may want to see the RTH open, the overnight high and low, and how far a session typically expands before looking for continuation. A London trader may care more about the Asia range, its midpoint, and whether London has delivered a clean raid before New York enters.
Average range data is valuable for one reason: it prevents target selection from becoming wishful thinking. If NQ has already traveled a large portion of its typical session range into external liquidity, continuation is still possible, but the burden of proof is higher. You are no longer treating every clean five-minute FVG as if it has unlimited room.
Using OHLC Statistics to Build Bias, Not Predict Every Tick
An OHLC statistics trading tool should support a process, not become a prediction machine. OHLC references tell you where price is. They do not tell you whether your entry model is valid.
Start from the higher timeframe. Identify whether price is delivering toward a clear external high or low, trading within a balanced range, or repricing after a displacement. Then use the current day's open, prior close, and prior range to assess location. If price is holding above the daily open, has taken sell-side liquidity, and is displacing through a lower-timeframe swing, a bullish intraday narrative has more structure behind it than a random long at equilibrium.
The inverse is equally useful. If price sweeps prior-day high into a premium area, fails to sustain above the session open, and prints bearish displacement, an OHLC framework helps you recognize that the buy-side raid occurred at a location where reversal is plausible. You still need your model - whether that is an IFVG, Unicorn, market structure shift, or a T-Spot area - to define risk and timing.
This distinction protects against a common mistake: treating a level as a trade. Prior day high is liquidity, not a sell button. Daily open is context, not a guaranteed magnet. Statistics narrow the decision tree. They do not remove discretion.
A Practical Pre-Session Workflow
Before the active session, review the prior day’s range and close. Did price close near an extreme, near equilibrium, or back inside a range after a sweep? Mark the current session’s opening reference and identify nearby external liquidity. Then compare the available space to normal range behavior.
From there, form conditional scenarios. If price holds above the open and raids the overnight low, you may look for bullish confirmation toward prior-day high. If it opens, expands into buy-side liquidity, and loses the opening reference with displacement, the better opportunity may be a reversal back through the range. The point is not to marry either scenario. It is to know what must happen before you participate.
During the session, statistics help you avoid chasing. A clean setup that appears after price has already completed its expected delivery into a major high is different from the same setup forming early in the range. The chart may look identical at the entry candle. The surrounding OHLC context is not identical.
Where OHLC Data Fits With ICT and SMC Models
OHLC statistics work best as the location layer underneath your model stack. Structure identifies the dealing range and directional shifts. Liquidity identifies likely objectives. FVGs and IFVGs can define repricing zones. SMT can add correlated-market confirmation. OHLC data ties those concepts to the session's actual opening and closing behavior.
Consider a bullish setup after a sell-side sweep. The setup gains quality if the sweep occurs below a meaningful prior low, price reclaims the daily open, and the upside objective remains within realistic session expansion. If correlated markets also show SMT, that is layered confluence rather than a single signal carrying the whole trade.
There are trade-offs. A heavy statistical display can encourage overanalysis, while a stripped-down display can hide the context that keeps you out of poor locations. The right configuration depends on what you trade. ES and NQ traders may prioritize RTH, overnight, and prior-day values. Forex traders may build their workflow around Asia, London, and New York session boundaries. The common requirement is consistency: use the same references often enough to learn how your market responds around them.
Automation Should Reduce Preparation, Not Replace Judgment
Manual marking is not difficult once. It becomes expensive when you repeat it across multiple symbols and timeframes before every session. That is where automated chart tools earn their place. They standardize the references, reduce missed levels, and let you spend more attention on price delivery.
Toodegrees approaches this as framework automation: the chart can present OHLC statistics alongside the liquidity, structure, and session context you already use, while the execution decision remains yours. That separation matters. A tool should make your process faster and more consistent, not persuade you to take trades your plan does not support.
Keep the display tied to the questions you actually ask. Where did the last meaningful period open and close? What liquidity is still available? Has price already expanded far enough to change the risk-reward profile? Is my lower-timeframe model forming in premium, discount, or the middle of a range?
When those answers are visible before the impulse candle arrives, you can wait for confirmation instead of reacting to it. That is the practical value of OHLC statistics: less chart preparation, fewer context-free entries, and more attention reserved for the trade that fits your framework.

Want These Concepts Automated?
Stop spending hours marking up charts. Our suite of 15 premium indicators automates the analysis discussed in these articles.