Fractal Model Trading Indicator for ICT Setups
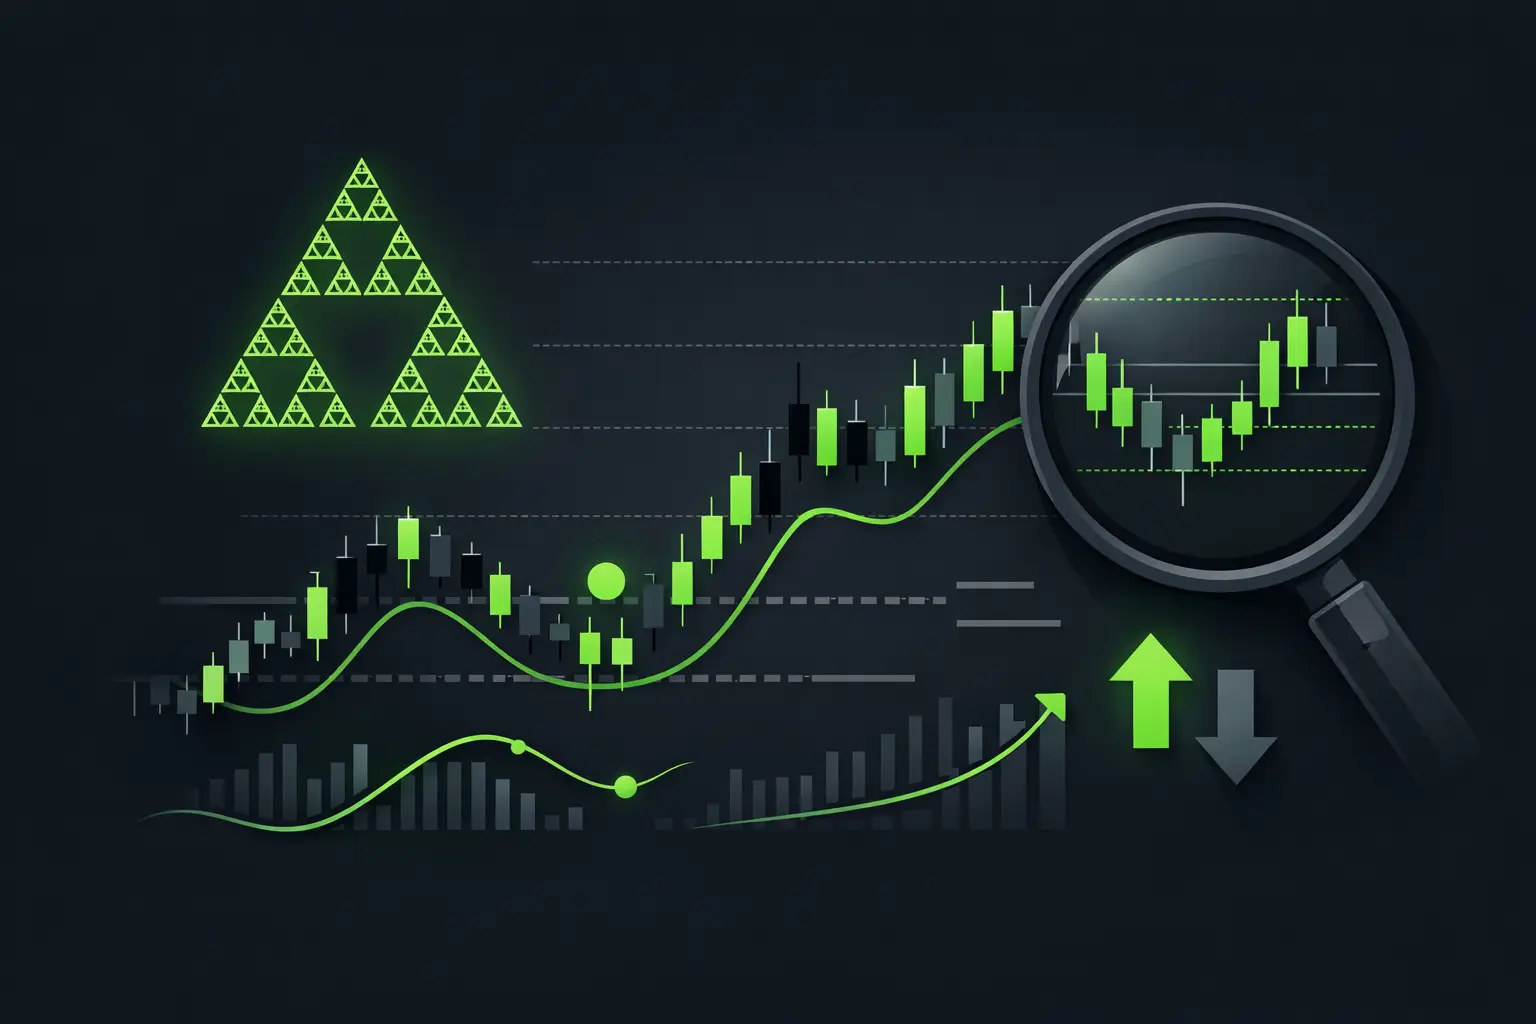
A clean chart can still hide a messy process. If you are manually comparing prior swings, dealing ranges, liquidity pools, and lower-timeframe confirmations before every New York session, the issue is not chart knowledge. It is repeatability. A fractal model trading indicator is built to organize recurring price behavior across timeframes so the trader can see context faster and reserve attention for execution.
For ICT and SMC traders, that distinction matters. Markets do not repeat tick for tick, but they regularly express familiar sequences: expansion from a range, a liquidity run, displacement, repricing into imbalance, and continuation or reversal. A fractal framework turns those recurring relationships into a charting process rather than a memory test.
What a Fractal Model Trading Indicator Is Actually Doing
In trading, “fractal” does not mean price is perfectly predictable at every scale. It means certain structural behaviors can appear on a higher timeframe and then reappear in a more detailed form on a lower timeframe. A daily dealing range may frame the week’s draw on liquidity. Inside that range, a 15-minute swing can establish the intraday objective. A 1-minute displacement may then provide the execution trigger.
A fractal model trading indicator helps connect those layers. Depending on its configuration, it may plot reference ranges, key swing relationships, liquidity targets, reversal signatures, equilibrium, or projected areas where price behavior becomes actionable. The goal is not to replace discretionary analysis. The goal is to stop rebuilding the same analysis from scratch every time you change symbols or timeframes.
That is especially useful when the market is moving fast. Once volatility expands, traders who are still drawing context often end up chasing the move they intended to trade. Prebuilt model logic gives you a visible framework before price reaches the area that matters.
Why Fractal Context Improves ICT and SMC Execution
Most weak setups are not weak because the entry pattern was wrong. They are weak because the pattern was taken in the wrong location, at the wrong time, or against the larger draw on liquidity.
A lower-timeframe market structure shift after a sweep can look convincing anywhere on the chart. It carries more weight when it occurs at a higher-timeframe premium or discount area, after price raids external liquidity, and while correlated markets support the idea. Fractal context keeps the LTF signal connected to the HTF narrative.
Consider an index futures session trading into a prior daily high. On the 5-minute chart, price may print a sharp rejection and a bearish displacement. That is not automatically a short. The question is whether the daily high was the intended liquidity objective, whether price has reached an area of premium within the active range, and whether the session has delivered enough expansion to make a reversal reasonable.
The same 5-minute signal after a shallow pullback in a strong bullish delivery has a different meaning. The chart pattern may be identical. The model context is not.
This is where automation earns its place. It places the relevant structure in front of you consistently, reducing the temptation to assign importance to whichever candle is moving most aggressively.
Build the Model From Top Down
A useful fractal workflow starts with the timeframe that defines the trade idea, not the timeframe used to enter it. For many intraday futures traders, that means daily and 4-hour context first, then 1-hour or 15-minute delivery, then the execution chart.
Start by identifying where price sits inside the larger range. Is it approaching buy-side or sell-side liquidity? Is it trading from discount toward equilibrium, or from premium toward discount? Has higher-timeframe displacement already confirmed a directional leg, or is price still balanced and rotating?
Next, reduce the scope. On the intraday timeframe, identify the active range and the session objective. This is where prior session highs and lows, opening ranges, fair value gaps, and local liquidity become useful. The model should make it easier to distinguish a genuine draw from a nearby level that is merely visible.
Only then move to the execution timeframe. Wait for price to interact with a location defined by the larger model. A sweep, CISD, market structure shift, inverse fair value gap, or displacement can provide confirmation, but it should be confirmation of context, not a standalone reason to click.
The sequence is simple: higher-timeframe location, intraday delivery, lower-timeframe confirmation. A fractal tool supports this sequence by keeping the references aligned while you work down the chart.
Use Confluence Without Creating a Checklist Trap
Confluence is not the same as collecting labels. A chart covered in order blocks, gaps, swing points, and session lines can create false confidence if none of those references answer the same question.
Good confluence is relational. A liquidity sweep matters more when it occurs at a modeled higher-timeframe level. A displacement matters more when it leaves an imbalance in the expected direction. SMT matters more when it appears as price reaches the anticipated objective rather than in the middle of a range.
Before taking a trade, pressure-test the model with four questions:
- What liquidity is price likely seeking next?
- Where is price within the active higher-timeframe range?
- What would confirm the idea on the execution timeframe?
- What price behavior would invalidate the premise?
If those answers are unclear, more indicators will not fix the trade. The correct response is usually to wait.
What to Configure on the Chart
The best settings depend on the instrument and holding period. ES and NQ may require different sensitivity because their intraday delivery and volatility profiles differ. A trader holding for a 10-point scalp also needs a different level of detail than a trader targeting a full session expansion.
Keep the chart focused on references that influence decisions. Higher-timeframe ranges, key liquidity, model areas, fair value gaps, session opens, and selected structure signals can work together. Every extra visual should earn its place by changing either your bias, entry, stop placement, or target.
This is why layered customization matters. You may want daily and 4-hour model levels visible on a 5-minute chart while limiting lower-timeframe labels until price reaches a decision zone. Too much automation can become noise. Too little returns you to manual preparation.
A platform-based tool such as Toodegrees' Fractal Model is most useful when it fits the framework you already trade. Configure it around your session, preferred timeframes, and confirmation rules. Do not force a model to create trades outside your plan.
Common Errors With Fractal Trading Models
The first error is treating a plotted level as a prediction. A model area is a place to pay attention, not a guarantee that price will reverse. Markets can trade through a premium zone, rebalance an imbalance, or run multiple layers of liquidity before delivering the expected move.
The second is ignoring time. A clean setup at 2:00 a.m. may not carry the same opportunity as the same setup during London or the New York cash open. Session timing, economic releases, and current volatility affect whether a fractal pattern has room to deliver.
The third is using the same model sensitivity across every market. A setting that reads structure well on NQ can be too slow or too noisy on crude oil, crypto, or a thin overnight contract. Test settings against the market and timeframe you actually trade.
Finally, do not confuse automation with risk management. An indicator can reduce preparation time and improve chart clarity. It cannot choose your position size, protect you from overtrading, or make a poor reward-to-risk profile acceptable.
Turn Chart Context Into a Repeatable Routine
The real value of a fractal model is operational. Before the session, mark the higher-timeframe draw, identify the active range, and define the prices where you will pay attention. During the session, let price come to those areas. At the level, use lower-timeframe delivery to decide whether the market is confirming or rejecting the idea.
Afterward, review the trade against the model rather than only judging the P&L. Did you enter at the intended location? Did the liquidity objective change? Was the confirmation early, late, or absent? This is how a charting tool becomes part of a process instead of another visual overlay.
A fractal framework will not remove uncertainty. It gives uncertainty a structure: where price is, what it may be seeking, and what must happen before your execution has a reason to exist. That leaves you with the work that cannot be automated - patience, risk control, and the discipline to trade only when the model and the market agree.


Want These Concepts Automated?
Stop spending hours marking up charts. Our suite of 15 premium indicators automates the analysis discussed in these articles.