Standard Deviation Price Projection for Traders
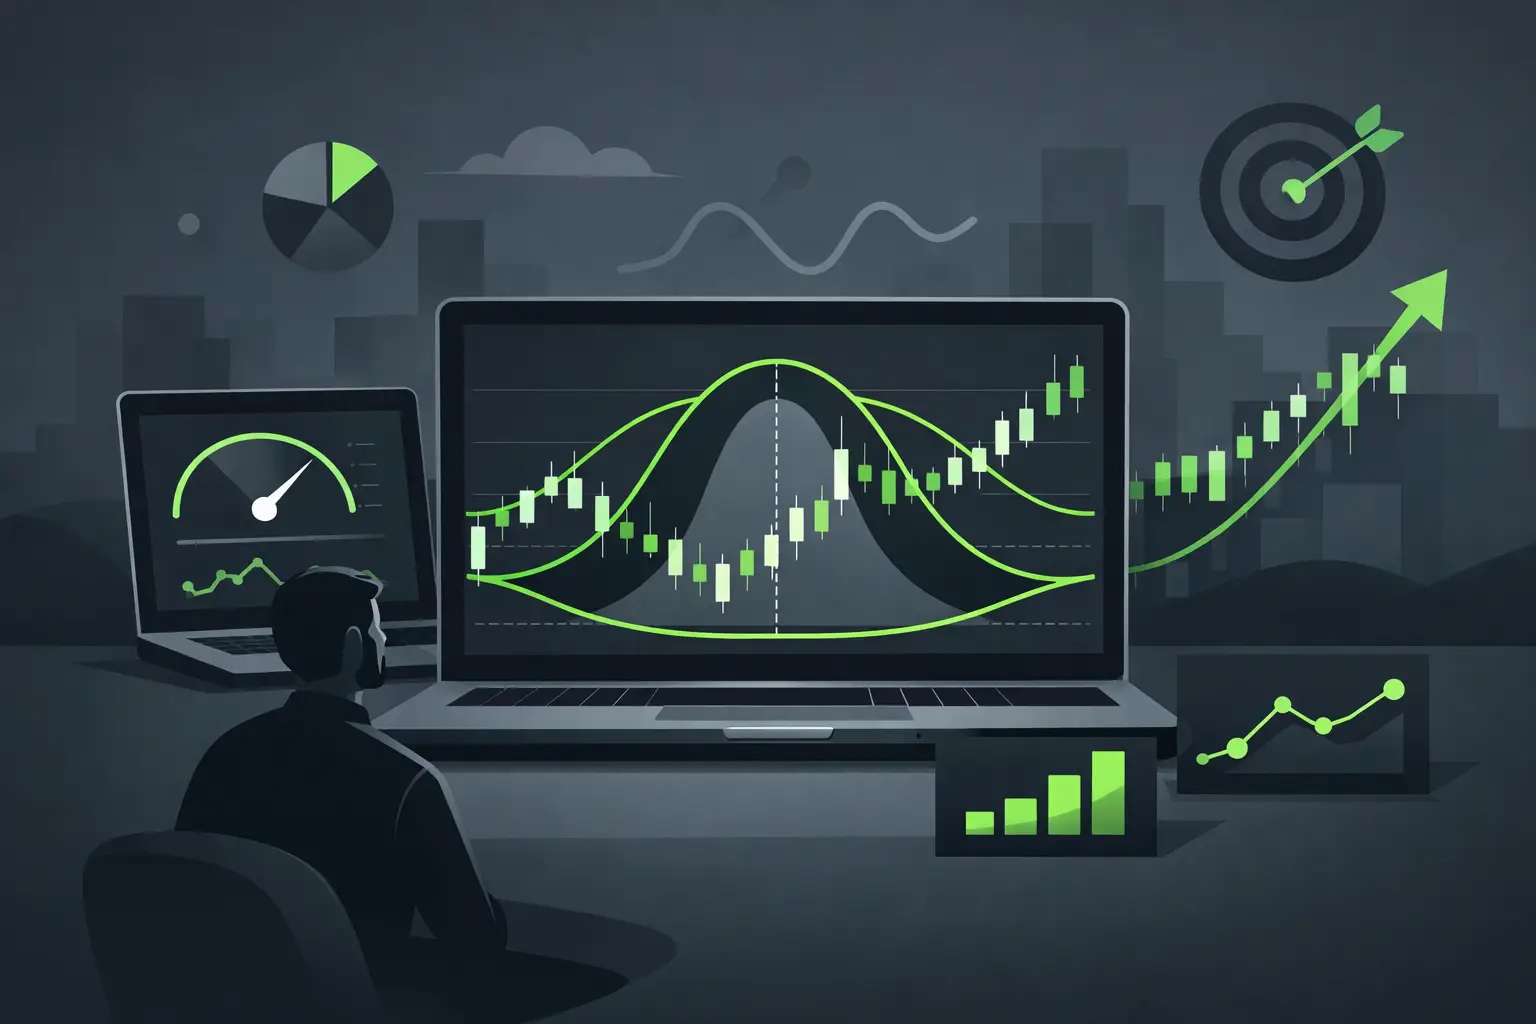
A standard deviation price projection is not a promise that price will reach a level. It is a way to quantify what a normal expansion, a stretched move, and an outlier move look like from a defined reference point. For active futures and index traders, that distinction matters. The projection should organize expectations before the session opens, not create a reason to force a trade after price has already moved.
When price opens into a known range, reacts from an HTF level, or displaces through liquidity, standard deviation levels give that move measurable context. Instead of calling every expansion "extended" by feel, you can see whether price is working within its expected range, pressing a first deviation, or trading into an area where continuation requires more proof.
What Standard Deviation Measures on a Chart
Standard deviation measures dispersion around an average. In trading terms, it helps answer a practical question: how far does price typically travel from a chosen reference during the period you are measuring?
A projection begins with an anchor, such as a daily open, weekly open, session open, prior settlement, or an established range midpoint. From there, the model applies a volatility measure to plot levels above and below that anchor. Those levels create an objective map of potential expansion and reversion areas.
The math matters less than using the inputs consistently. If you change the anchor, lookback, or session definition whenever a level does not fit your bias, the projection loses its value. A repeatable model gives you comparable data from one session to the next.
In a normal distribution, roughly 68% of observations fall within one standard deviation of the mean, while roughly 95% fall within two. Markets are not perfectly normal distributions. They gap, trend, reprice around news, and move through thin liquidity. Still, the framework is useful because it turns volatility into a visible operating range rather than a vague feeling.
Standard Deviation Price Projection in an Intraday Framework
For intraday execution, the best use of a standard deviation price projection is as a location tool. It tells you where price sits relative to an expected range. It does not replace market structure, liquidity, order flow, or timing.
A clean workflow starts before the active session. Mark the higher-timeframe draw on liquidity, the relevant daily or weekly dealing range, major PD arrays, and session references. Then place the deviation projection from the anchor your plan uses. For an index futures trader, that may be the RTH open. For another model, it may be the midnight open or a weekly reference.
Once the session begins, read price in relation to the map. If price is below the open and fails to reclaim a bearish IFVG while targeting sell-side liquidity, the lower deviation levels can frame logical objectives. If price raids sell-side liquidity at a lower projection, shifts structure, and delivers bullish displacement, that same level may become a location for a reversal model instead of a continuation target.
That is the key distinction: deviation levels are not directional. Context determines whether a level is likely to attract price, reject price, or be traded through.
The first deviation
The first standard deviation often represents a meaningful but still ordinary expansion from the anchor. In a balanced session, price may rotate between the open and the first upper or lower projection. In a directional session, it may accept beyond that level and use it as support or resistance during continuation.
Do not automatically fade a first deviation. A strong opening displacement, clean imbalance, and aligned HTF bias can make a first deviation a checkpoint, not an endpoint. If price reaches it with deceleration, opposing liquidity swept, and a lower-timeframe market structure shift, the probability of a reaction improves. The level alone is not the setup.
Second and third deviations
Second deviation areas deserve more attention because price is farther from the reference and the market has already delivered a larger-than-normal move. That can create two very different conditions.
In a trend day, price can expand through a second deviation without meaningful reversal. Trying to short every upper extension or buy every lower extension is a fast way to fight the session. Look for acceptance, displacement quality, and whether retracements are shallow. If price is holding above a reclaimed first deviation and leaving bullish imbalances behind, continuation remains valid until structure proves otherwise.
In a mean-reversion day, a second or third deviation can become high-quality location when it aligns with external liquidity, a premium or discount array, SMT divergence, and a clear LTF reversal signal. The more independent factors that align, the less you need to rely on the projection itself.
Choose the Right Anchor Before You Trade
The anchor is the decision that drives the entire projection. A useful level built from the wrong reference can still be irrelevant to your model.
Session-based traders often benefit from an RTH or overnight anchor because it reflects the portion of the day they actually trade. Traders building around weekly profiles may prefer a weekly opening reference. If your strategy is built around a specific opening range or statistical model, use that anchor consistently enough to collect evidence.
There is no universal best setting. ES during New York morning delivery behaves differently from NQ during a high-impact data release. Crude oil has its own session rhythm. A projection that performs well for a balanced RTH index session may not translate directly to an overnight, news-driven move.
Test the model by market, session, and setup type. Track how often price reaches each deviation, what happens after the first touch, and whether continuation or reversion occurs after a confirmed trigger. You are not trying to find a magic percentage. You are trying to understand where your execution model performs best.
Build Confluence, Not Dependency
A projection becomes more valuable when it overlaps with the references already in your framework. That can include prior day high or low, an FVG, an IFVG, equilibrium, a session high or low, a correlated-market divergence, or a higher-timeframe order block.
For example, imagine NQ trades lower through the New York open, takes overnight sell-side liquidity, and reaches a lower second deviation that overlaps with a bullish HTF FVG. If ES fails to confirm the low, SMT is present. If NQ then displaces higher and leaves a bullish FVG after a CISD, you have a structured reversal narrative: location, liquidity event, divergence, confirmation, and defined targets.
The projection did not call the bottom. It gave the reversal model a meaningful location and helped define where the move had become statistically extended from the chosen anchor.
The same logic applies to targets. A trader long from a discount array may use the open, first upper deviation, prior high, and upper liquidity as sequential objectives. That creates a plan for scaling or managing risk without pretending every position must reach the furthest projected level.
Common Errors That Distort the Read
The first error is treating all deviation touches as reversal signals. A deviation level is a price location, not confirmation. Price can trade through it, accept beyond it, and continue for hours.
The second is ignoring event risk. CPI, FOMC, NFP, and major earnings or geopolitical headlines can expand realized volatility far beyond a normal session profile. On those days, the projection still shows location, but expectations must adjust. Reduced size, wider structure-based invalidation, or no trade may be the better decision.
The third is stacking too many projections. Daily, weekly, monthly, RTH, overnight, and custom anchors can turn the chart into a field of lines. If every price is a level, no price is a level. Keep the references that directly support your execution window and remove the rest.
Finally, avoid moving the anchor after the fact to make a setup look cleaner. The value of statistics is accountability. Define the reference before the move, then review whether your read and execution followed the plan.
Automate the Map, Keep the Decision Manual
Manual calculations and repeated chart markup consume attention that belongs on execution. A TradingView overlay can keep deviation projections visible across timeframes while preserving the trader's control over bias, entries, and risk. Toodegrees tools are built around that division of labor: automate the recurring chart work, then let the trader interpret the confluence.
The practical goal is chart clarity. You should be able to open a market before the session, see the projected range in context with your key ICT/SMC references, and know what would confirm continuation versus reversal. If the chart requires ten minutes of rebuilding before you can make that call, the workflow is too slow.
A standard deviation price projection earns its place when it improves discipline. Use it to define where price is relative to expectation, wait for your model to confirm the idea, and let invalidation tell you when the read is wrong. That is far more useful than asking any projected line to predict the next tick.
Want These Concepts Automated?
Stop spending hours marking up charts. Our suite of 15 premium indicators automates the analysis discussed in these articles.